
June 18, 2026 a 04:44 pm
TRV: Fibonacci Analysis - The Travelers Companies, Inc.
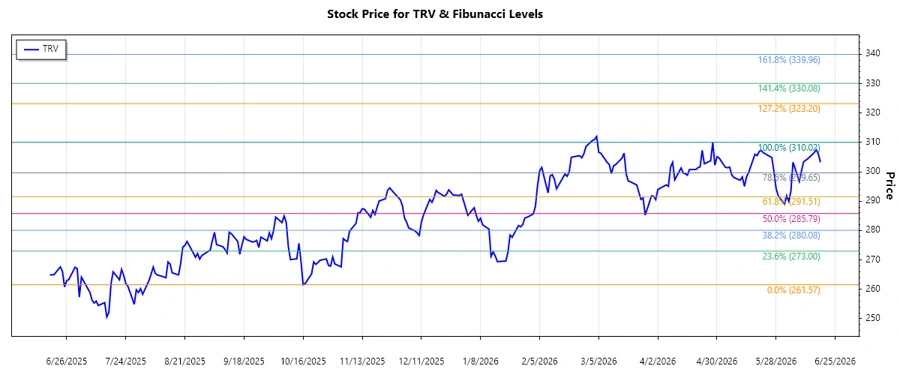
The Travelers Companies, Inc. has experienced a significant upward trend over the past several months. The stock's strong performance is bolstered by its diversified insurance offerings across business, specialty, and personal segments. As the company continues to expand both domestically and internationally, it remains a resilient player in the insurance market, navigating challenges with strategic risk management.
Fibonacci Analysis
| Detail | Information |
|---|---|
| Trend Type | Up |
| Start Date | 2025-10-16 |
| End Date | 2026-04-28 |
| High (Price/Date) | $310.02 / 2026-04-28 |
| Low (Price/Date) | $261.57 / 2025-10-16 |
| Fibonacci Levels |
|
| Retracement Zone | 0.618 |
| Interpretation | The current price is within the 0.618 retracement level, indicating a strong potential for support. Traders may view this as a buying opportunity within a continued uptrend. |
Conclusion
The Travelers Companies, Inc. has shown robust growth, bolstered by a well-diversified insurance offering and strategic market positioning. The recent Fibonacci analysis highlights a strong upward trajectory, with key support observed at the 0.618 retracement level. While market conditions always pose risks, the company's solid fundamentals provide a buffer. Analysts may consider the current retracement zone as a resilient support, offering a potential entry point for investors aiming to capitalize on continued growth. The ongoing expansion across varied insurance segments suggests further potential for long-term appreciation.
Smart Data Insight
Master the Perfect Entry & Exit for this Stock
Don't leave your profits to chance. Historically, this stock follows specific seasonal patterns that institutional traders use to maximize returns.
- ✅ Identify the "Golden Buying Window"
- ✅ Avoid high-risk correction cycles
- ✅ Backtested data from the last 20+ years