May 01, 2026 a 03:15 pm
TRV: Fibonacci Analysis - The Travelers Companies, Inc.
The Travelers Companies, Inc. has demonstrated robust resilience, balancing its diverse range of insurance products and services both in the United States and internationally. With a comprehensive portfolio spanning commercial, specialty, and personal insurance segments, TRV has positioned itself as a formidable player in the insurance sector. Recent stock analysis suggests a nuanced performance influenced by broader economic conditions, but historical data indicates periods of both strong performance and strategic stability.
Fibonacci Analysis
| Aspect | Detail |
|---|---|
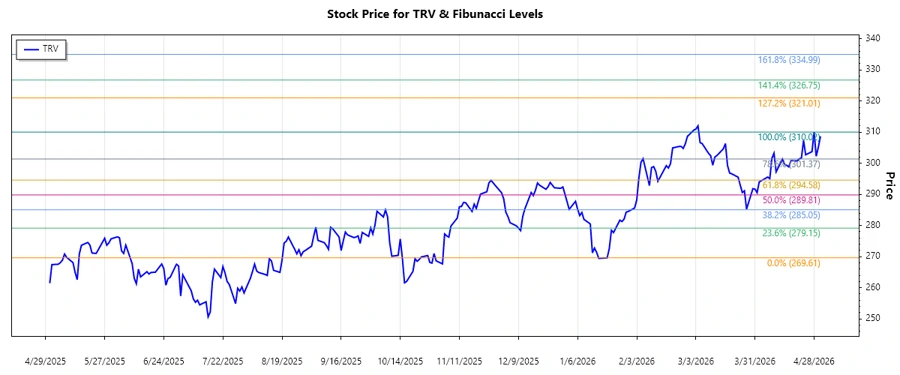
| Start and End Date of Trend | 2026-01-20 to 2026-04-28 |
| High Point | $310.02 on 2026-04-28 |
| Low Point | $269.61 on 2026-01-20 |
| Fibonacci Levels |
|
| Current Price Zone | Between 0.5 and 0.618 |
| Technical Interpretation | The current price suggests potential support at 0.5 Fibonacci level, with a weak upside observed toward the 0.618 level. |
Conclusion
The Travelers Companies, Inc., as analyzed through Fibonacci retracement, shows a varied potential with the current trend reflecting potential stabilizing points. While the 0.5 level might act as a support, upward momentum would need to be observed for a more bullish outlook. The combination of diverse insurance offerings and robust market positioning provides TRV with unique strengths, though exposure to economic oscillations remains a risk. Analysts will be closely observing these technical markers as indicators for future stability or volatility.