
July 13, 2026 a 12:46 pm

TRV: Dividend Analysis - The Travelers Companies, Inc.
The Travelers Companies, Inc. is a strong player in the insurance sector with a notable history of dividend payments stretched over 42 years. The company’s consistent payout history and moderate growth in dividends indicate a stable investment opportunity for income-focused portfolios.
📊 Overview
The Travelers Companies, Inc. operates within the insurance sector, experiencing consistent but modest dividend yields. The current dividend yield sits at 1.50%, with a dividend per share of 4.37 USD, supported by 42 years of dividend history without any recent cuts or suspensions. These attributes highlight the company’s commitment to returning value to shareholders.
| Sector | Dividend Yield | Current Dividend per Share | Dividend History | Last Cut/Suspension |
|---|---|---|---|---|
| Insurance | 1.50% | 4.37 USD | 42 years | None |
🔍 Dividend History
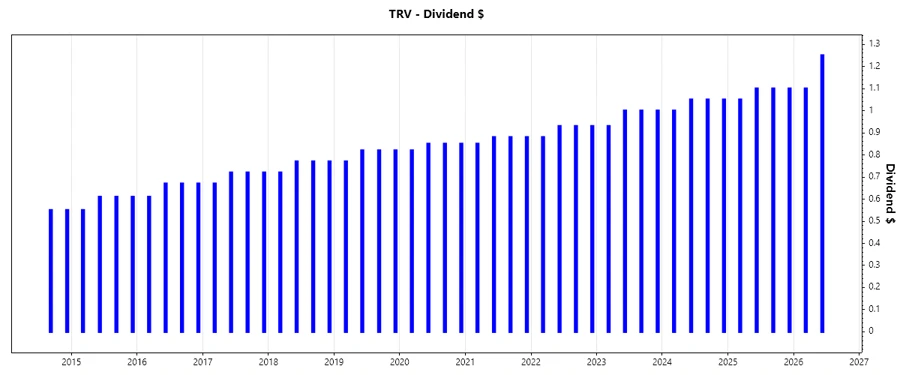
The dividend history of a company provides insights into its commitment to returning capital to shareholders. Travelers has a long and stable history, which should reassure investors looking for consistent income.
| Year | Dividend per Share |
|---|---|
| 2026 | 2.35 USD |
| 2025 | 4.35 USD |
| 2024 | 4.15 USD |
| 2023 | 3.93 USD |
| 2022 | 3.67 USD |
📈 Dividend Growth
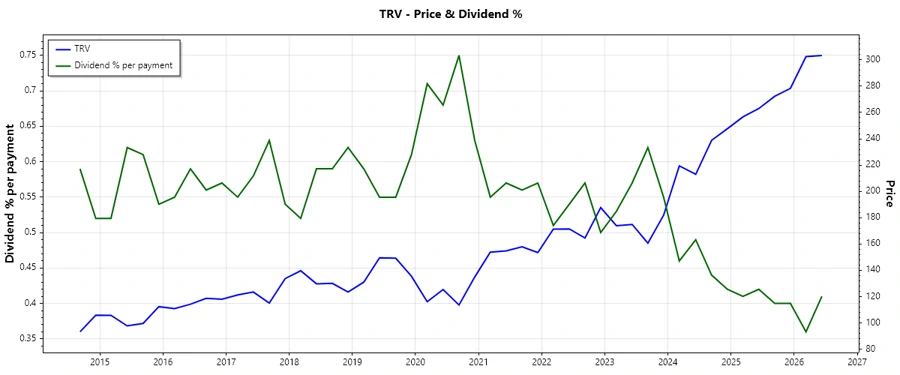
Analyzing the growth of dividends over periods of three and five years helps predict future performance. Travelers has a modest growth rate, reflecting stability and the potential for long-term income.
| Time | Growth |
|---|---|
| 3 years | 5.83% |
| 5 years | 5.24% |
The average dividend growth is 5.24% over 5 years. This shows moderate but steady dividend growth.
📉 Payout Ratio
The payout ratio is a crucial indicator of dividend sustainability, reflecting the percentage of earnings distributed to shareholders.
| Key Figure | Ratio |
|---|---|
| EPS-based | 12.36% |
| Free cash flow-based | 8.11% |
With an EPS payout ratio of 12.36% and a FCF payout ratio of 8.11%, Travelers maintains a conservative approach, ensuring future dividend distributions remain secure."
💰 Cashflow & Capital Efficiency
Cash flows are vital for evaluating the company's financial health. These metrics help investors understand capital expenditure and operational cash generation efficiency.
| Metric/Year | 2025 | 2024 | 2023 |
|---|---|---|---|
| Free Cash Flow Yield | 16.31% | 16.52% | 17.54% |
| Earnings Yield | 9.67% | 9.10% | 6.80% |
| CAPEX to Operating Cash Flow | 0% | 0% | 0% |
| Stock-based Compensation to Revenue | 0.05% | 0% | 0% |
| Free Cash Flow / Operating Cash Flow Ratio | 100% | 100% | 100% |
The cash flow and capital efficiency metrics indicate robust operational performance and effective capital management, ensuring adequate coverage for dividend payments.
🔍 Balance Sheet & Leverage Analysis
This analysis provides insights into the company’s financial stability by examining its debt levels and capital structure.
| Metric/Year | 2025 | 2024 | 2023 |
|---|---|---|---|
| Debt-to-Equity | 0.28 | 0.29 | 0.32 |
| Debt-to-Assets | 0.06 | 0.06 | 0.06 |
| Debt-to-Capital | 0.22 | 0.22 | 0.24 |
| Net Debt to EBITDA | 0.82 | 1.02 | 1.65 |
| Current Ratio | 1.31 | 1.26 | 1.41 |
| Quick Ratio | 0.55 | 1.26 | 1.41 |
| Financial Leverage | 4.37 | 4.78 | 5.06 |
The relatively low leverage ratios ensure that Travelers remains financially stable with sufficient liquidity to manage its obligations.
✅ Fundamental Strength & Profitability
Understanding fundamental strength and profitability ratios is crucial for assessing a company’s operational efficiency and market position.
| Metric/Year | 2025 | 2024 | 2023 |
|---|---|---|---|
| Return on Equity | 19.12% | 17.94% | 12.00% |
| Return on Assets | 4.38% | 3.75% | 2.37% |
| Net Margin | 12.88% | 10.77% | 7.23% |
| EBIT Margin | 16.84% | 14.16% | 9.06% |
| EBITDA Margin | 18.23% | 15.70% | 10.80% |
| Gross Margin | 44.25% | 26.70% | 21.59% |
| R&D to Revenue | 0% | 0% | 0% |
Travelers shows strong profitability with stable margins, reflecting well on its ability to generate consistent returns for shareholders.
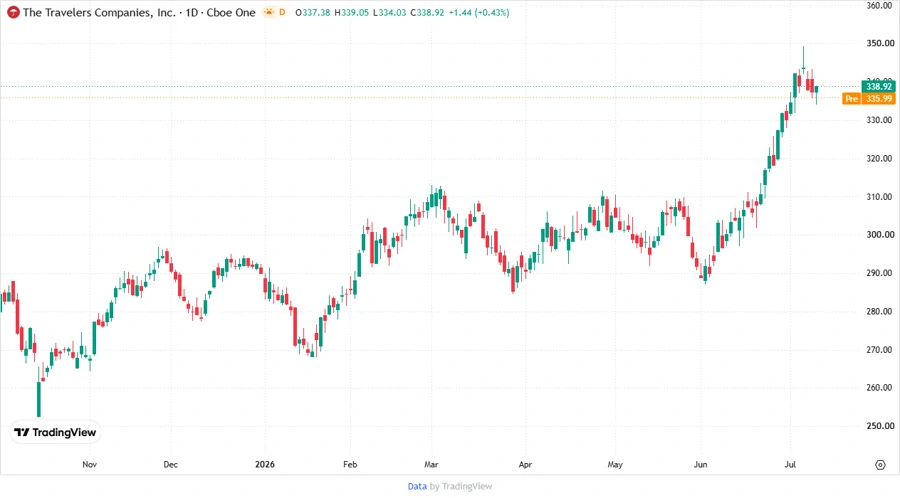
📊 Price Development
Scoring System (H2):
A scoring system to evaluate dividend sustainability and financial health across multiple criteria
| Category | Score | |
|---|---|---|
| Dividend Yield | 3 | |
| Dividend Stability | 5 | |
| Dividend Growth | 4 | |
| Payout Ratio | 5 | |
| Financial Stability | 4 | |
| Dividend Continuity | 5 | |
| Cashflow Coverage | 4 | |
| Balance Sheet Quality | 4 |
Total Score: 34/40
📊 Rating
The Travelers Companies, Inc. presents a robust dividend profile with excellent stability and payout ratios. Its modest dividend growth and firm financial footing suggest that it remains a strong candidate for investors seeking dependable dividend income. Recommended for further research for those prioritizing income stability.
Smart Data Insight
Master the Perfect Entry & Exit for this Stock
Don't leave your profits to chance. Historically, this stock follows specific seasonal patterns that institutional traders use to maximize returns.
- ✅ Identify the "Golden Buying Window"
- ✅ Avoid high-risk correction cycles
- ✅ Backtested data from the last 20+ years