March 05, 2026 a 07:31 am


TRV: Dividend Analysis - The Travelers Companies, Inc.
The Travelers Companies, Inc. (TRV) has demonstrated a robust dividend history with stability and growth over 42 years, making it a reliable choice for income-focused investors. Despite modest current yields, the historical consistency suggests confidence in long-term payouts, positioning the company favorably within the insurance sector. Investors should assess the sustainable payout ratios and capital efficiency metrics alongside the solid dividend track record TRV holds.
📊 Overview
| Key Metric | Details |
|---|---|
| Sector | Insurance |
| Dividend Yield | 1.41% |
| Current Dividend per Share | 4.37 USD |
| Dividend History | 42 years |
| Last Cut or Suspension | None |
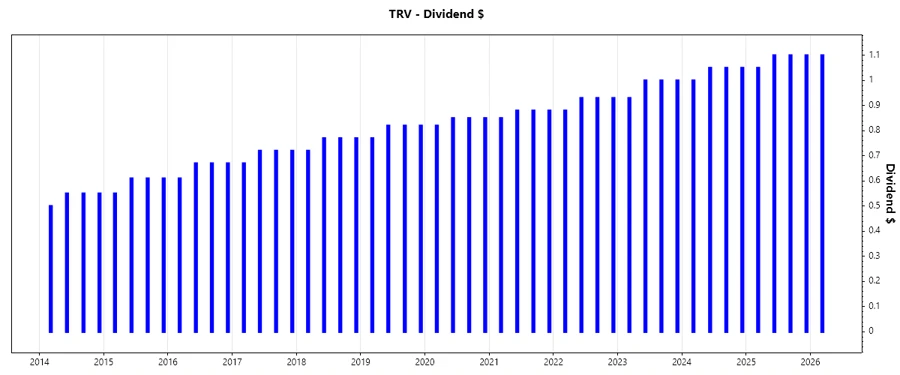
📈 Dividend History
The Travelers Companies, Inc. has maintained an impressive 42-year track record of stable dividend payments, signaling reliability and maturity, crucial for investor confidence in the insurance sector.
| Year | Dividend per Share (USD) |
|---|---|
| 2026 | 1.10 |
| 2025 | 4.35 |
| 2024 | 4.15 |
| 2023 | 3.93 |
| 2022 | 3.67 |
📉 Dividend Growth
The growth of dividends over the past years highlights sound financial health and shareholder value focus, offering superior growth prospects even amidst market volatility.
| Time | Growth |
|---|---|
| 3 years | 5.83% |
| 5 years | 5.24% |
The average dividend growth is 5.24% over 5 years. This shows moderate but steady dividend growth.
✅ Payout Ratio
The payout ratio aids in evaluating dividend sustainability concerning earnings and free cash flow - vital for financial foresight and cash flow dynamics in dividend strategy assessments.
| Key Figure | Ratio |
|---|---|
| EPS-based | 15.30% |
| Free cash flow-based | 12.30% |
The EPS and FCF payout ratios are notably low, at 15.30% and 12.30%, respectively, indicating substantial room for growth and robust coverage for maintaining dividends.
✅ Cashflow & Capital Efficiency
Understanding the company's cash flow and capital efficiency highlights its potential longevity and operational strength - fundamental for any comprehensive dividend assessment.
| Metric | 2025 | 2024 | 2023 |
|---|---|---|---|
| Free Cash Flow Yield | N/A | 16.52% | 17.62% |
| Earnings Yield | 9.67% | 9.10% | 6.84% |
| CAPEX to Operating Cash Flow | N/A | 0% (High stability reflected) | 0% (High stability reflected) |
| Stock-based Compensation to Revenue | N/A | 0% | 0% |
| Free Cash Flow / Operating Cash Flow Ratio | N/A | 100% | 100% |
The cash flow metrics convey high efficiency with strong free cash flow yield, boosting confidence in ongoing capital effectiveness and potential for shareholder returns.
🗣️ Balance Sheet & Leverage Analysis
Analyzing the balance sheet is critical for assessing a company's leverage, risk management, and overall financial health, critical for sustainable dividend projections.
| Metric | 2025 | 2024 | 2023 |
|---|---|---|---|
| Debt-to-Equity | 0.28 | 0.29 | 0.32 |
| Debt-to-Assets | 0.06 | 0.06 | 0.06 |
| Debt-to-Capital | 0.22 | 0.22 | 0.24 |
| Net Debt to EBITDA | 0.95 | 1.02 | 1.69 |
| Current Ratio | 0.23 | N/A | N/A |
| Quick Ratio | 0.23 | N/A | N/A |
The leverage ratios demonstrate a healthy structure with controlled debt levels, promoting stability essential for dividend coverage and financial resilience.
🗣️ Fundamental Strength & Profitability
Profitability metrics provide insight into operational efficiency and financial strength, underlying much of investor confidence in specialty-driven stocks.
| Metric | 2025 | 2024 | 2023 |
|---|---|---|---|
| Return on Equity | 19.12% | 17.94% | 12.00% |
| Return on Assets | 4.38% | 3.75% | 2.37% |
| Margins: Net | 12.88% | 10.77% | 7.23% |
| EBIT | 16.84% | 14.16% | 9.06% |
| EBITDA | 18.23% | 15.70% | 10.80% |
| Gross | 44.25% | 26.70% | 21.59% |
| Research & Development to Revenue | 0% | 0% | 0% |
The company boasts robust profitability metrics, with high returns on equity, indicating operational excellence and shareholder value, even amidst external pressures.
📈 Price Development
✅ Dividend Scoring System
| Category | Points | Score Bar |
|---|---|---|
| Dividend Yield | 2 | |
| Dividend Stability | 5 | |
| Dividend Growth | 4 | |
| Payout Ratio | 5 | |
| Financial Stability | 4 | |
| Dividend Continuity | 5 | |
| Cashflow Coverage | 5 | |
| Balance Sheet Quality | 4 |
Overall Score: 34/40
⚠️ Rating
Travelers Companies, Inc. is highly recommended for risk-averse investors seeking consistent dividend payouts due to its strong historical performance and stable financial metrics. This solid track record endorses its role in a diversified, longer-term income portfolio, notwithstanding a moderate yield.