
February 13, 2026 a 07:46 am
TRV: Dividend Analysis - The Travelers Companies, Inc.
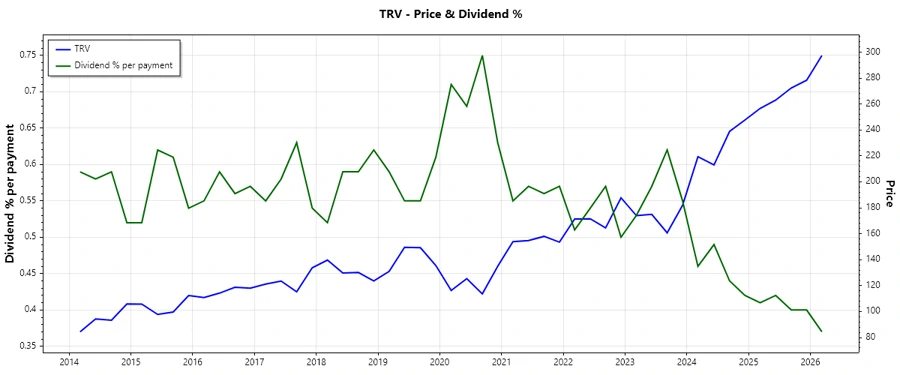
The Travelers Companies, Inc. (TRV) presents a solid dividend profile with a strong history of 42 years without any dividend cuts or suspensions. Its diverse business model in the insurance sector contributes to its stable financial performance. However, investors should note its relatively low dividend yield of 1.48%, which might not be attractive for those seeking immediate income. The consistent moderate growth in dividends reflects the company's focus on sustainable shareholder returns.
📊 Overview
Travelers operates within the insurance sector, demonstrating steady dividend returns. Here's a brief overview of its current dividend profile:
| Key Metrics | Details |
|---|---|
| Sector | Insurance |
| Dividend Yield | 1.48% |
| Current Dividend Per Share | 4.37 USD |
| Dividend History | 42 years |
| Last Cut or Suspension | None |
🗣️ Dividend History
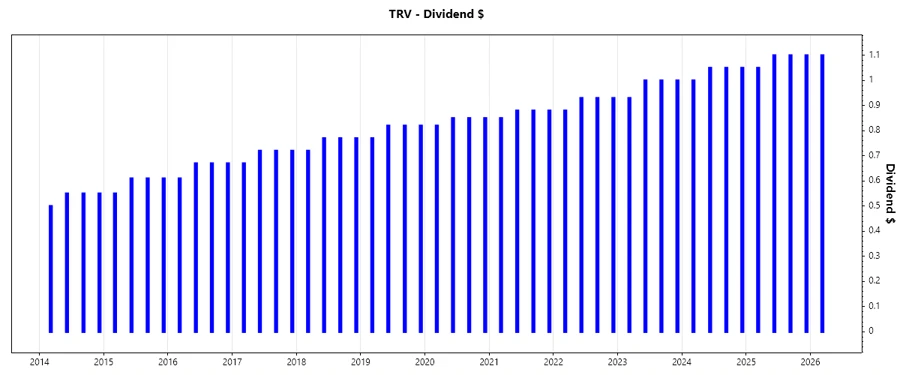
The 42-year uninterrupted dividend history of TRV is a testament to its financial stability and consistent cash flow generation. Understanding this is crucial, as a steady dividend history is often linked to a company's ability to navigate economic cycles without sacrificing shareholder returns.
| Year | Dividend Per Share |
|---|---|
| 2026 | 1.10 |
| 2025 | 4.35 |
| 2024 | 4.15 |
| 2023 | 3.93 |
| 2022 | 3.67 |
📈 Dividend Growth
The consistent dividend growth over 3 and 5 years is an indicator of TRV's disciplined capital management. Such growth is critical for long-term investors seeking to maximize their returns through compounding.
The average dividend growth is 5.24% over 5 years. This shows moderate but steady dividend growth.
| Time Frame | Growth |
|---|---|
| 3 years | 5.83% |
| 5 years | 5.24% |
✅ Payout Ratio
The payout ratio is a crucial metric for assessing how comfortably a company can pay dividends from its earnings. TRV's ratios indicate a conservative approach, with earnings-based payout at 15.30% and free cash flow-based payout at 12.30%, offering a significant margin for reinvestment or financial buffers in challenging times.
| Key Figure | Ratio |
|---|---|
| EPS-based | 15.30% |
| Free cash flow-based | 12.30% |
Cashflow & Capital Efficiency
Evaluating key metrics related to cash flow and capital efficiency aids in understanding a company’s operational health and its ability to sustain and grow dividends.
| Metrics | 2023 | 2024 | 2025 |
|---|---|---|---|
| Free Cash Flow Yield | 11.94% | 16.52% | 0% |
| Earnings Yield | 9.60% | 9.10% | 9.67% |
| CAPEX/Operating Cash Flow | 25.32% | 0% | 100% |
| Stock-based Compensation/Revenue | -0.26% | 0% | 0% |
| Free Cash Flow/Operating Cash Flow | 0% | 100% | 0% |
The data suggests a strong cash generation capability, although the reliance on free cash flow varies across the years.
Balance Sheet & Leverage Analysis
Assessing leverage ratios helps in identifying the company’s reliance on debt. A well-structured balance sheet can mitigate risks associated with economic downturns.
| Metrics | 2023 | 2024 | 2025 |
|---|---|---|---|
| Debt-to-Equity | 0.32 | 0.29 | 0.28 |
| Debt-to-Assets | 0.06 | 0.06 | 0.06 |
| Debt-to-Capital | 0.24 | 0.22 | 0.22 |
| Net Debt to EBITDA | 1.69 | 1.02 | 0.95 |
| Current Ratio | 0.23 | 0.00 | 0.23 |
| Quick Ratio | 0.23 | 0.00 | 0.23 |
| Financial Leverage | 5.06 | 4.78 | 4.37 |
Travelers maintains balanced debt levels, which promotes financial flexibility and stability.
Fundamental Strength & Profitability
Profitability ratios are indicative of how effectively a company can generate income relative to its assets, equity, and invested capital.
| Metrics | 2023 | 2024 | 2025 |
|---|---|---|---|
| Return on Equity | 12.00% | 17.94% | 19.12% |
| Return on Assets | 2.37% | 3.75% | 4.38% |
| Net Margin | 7.23% | 10.77% | 12.88% |
| EBIT Margin | 9.06% | 14.16% | 16.84% |
| Gross Margin | 21.59% | 26.70% | 44.25% |
| R&D/Revenue | 0% | 0% | 0% |
Traveler’s profitability metrics reinforce its robust business model and effective cost controls, benefitting from diversified operations.
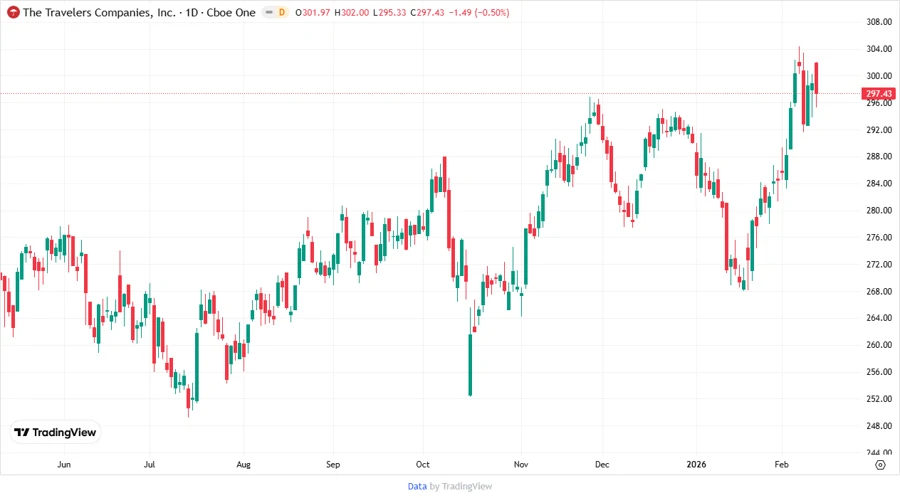
Price Development
Dividend Scoring System
| Criteria | Score | |
|---|---|---|
| Dividend Yield | 2 | |
| Dividend Stability | 5 | |
| Dividend Growth | 3 | |
| Payout Ratio | 4 | |
| Financial Stability | 4 | |
| Dividend Continuity | 5 | |
| Cashflow Coverage | 3 | |
| Balance Sheet Quality | 4 |
Total Score: 30/40
Rating
In conclusion, The Travelers Companies, Inc. showcases a remarkable track record of dividend practices. While its dividend yield might not attract yield-focused investors, its excellent dividend stability, prudent financial management, and solid growth metrics make it a viable investment for growth-oriented and risk-averse investors. The company earns an overall strong rating, reflecting a stable prospect in terms of both income and capital appreciation potential.
Smart Data Insight
Master the Perfect Entry & Exit for this Stock
Don't leave your profits to chance. Historically, this stock follows specific seasonal patterns that institutional traders use to maximize returns.
- ✅ Identify the "Golden Buying Window"
- ✅ Avoid high-risk correction cycles
- ✅ Backtested data from the last 20+ years