December 02, 2025 a 07:31 am

TRV: Dividend Analysis - The Travelers Companies, Inc.
The Travelers Companies, Inc. exhibits a resilient dividend profile with a commendable history of consistent payouts spanning over four decades. Key highlights include a modest dividend yield and prudent payout ratios, supporting a stable growth outlook. The commitment to shareholder returns is evident, bolstered by solid financial metrics and capital efficiency.
📊 Overview
The Travelers Companies, Inc. operates within the insurance industry, reflecting its capacity for stable cash flow and dividend payouts. The following table provides a snapshot of its current dividend landscape:
| Metric | Value |
|---|---|
| Sector | Insurance |
| Dividend Yield | 1.50% |
| Current Dividend Per Share | 4.17 USD |
| Dividend History | 41 years |
| Last Cut or Suspension | 2005 |
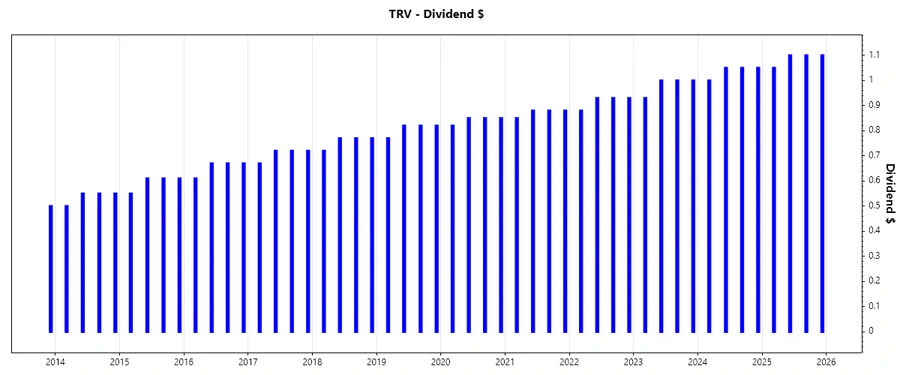
🗣️ Dividend History
The historic commitment of The Travelers Companies, Inc. to its dividend policy is illustrated by over 40 years of consistent payments, highlighting the firm’s stability and shareholder focus.
| Year | Dividend Per Share |
|---|---|
| 2025 | 4.35 |
| 2024 | 4.15 |
| 2023 | 3.93 |
| 2022 | 3.67 |
| 2021 | 3.49 |
📈 Dividend Growth
Examining the dividend growth over the past few years reveals steady increments, indicating the company's ability to enhance shareholder value progressively.
| Time | Growth |
|---|---|
| 3 years | 5.94% |
| 5 years | 5.14% |
The average dividend growth is 5.14% over 5 years. This shows moderate but steady dividend growth.
✅ Payout Ratio
The payout ratios are vital for assessing dividend sustainability. The following table summarizes these metrics for The Travelers Companies, Inc.:
| Key Figure Ratio | Percentage |
|---|---|
| EPS-based | 15.91% |
| Free Cash Flow-based | 9.44% |
With a low EPS and FCF payout ratio, The Travelers Companies, Inc. maintains ample room for reinvestment and flexibility, indicating strong dividend sustainability.
✅ Cashflow & Capital Efficiency
Understanding cash flow and capital efficiency is integral to evaluating a company's ability to sustain dividends. The table below provides insight into these crucial metrics for the most recent fiscal years:
| Metric | 2022 | 2023 | 2024 |
|---|---|---|---|
| Free Cash Flow Yield | 14.55% | 17.62% | 16.52% |
| Earnings Yield | 6.40% | 6.84% | 9.10% |
| CAPEX to Operating Cash Flow | 0% | 0% | 0% |
| Stock-based Compensation to Revenue | 0% | 0% | 0% |
| Free Cash Flow / Operating Cash Flow Ratio | 100% | 100% | 100% |
These metrics demonstrate robust cash flow and highly efficient capital usage, underpinning the company's capacity to maintain and grow its dividends in the foreseeable future.
💼 Balance Sheet & Leverage Analysis
Analyzing leverage and balance sheet strength is essential to understanding the financial security of dividend distributions. Below are key leverage ratios over recent fiscal years:
| Metric | 2022 | 2023 | 2024 |
|---|---|---|---|
| Debt-to-Equity | 33.82% | 32.23% | 28.83% |
| Debt-to-Assets | 6.30% | 6.37% | 6.03% |
| Debt-to-Capital | 25.27% | 24.37% | 22.38% |
| Net Debt to EBITDA | 1.43 | 1.65 | 1.01 |
| Current Ratio | 23.58 | 27.38 | 29.33 |
| Quick Ratio | 23.58 | 27.38 | 29.33 |
| Financial Leverage | 5.37 | 5.06 | 4.78 |
The Travelers Companies, Inc. showcases a stable leverage profile, complemented by strong liquidity indicators, ensuring ongoing fiscal health and reducing dividend risks.
🏆 Fundamental Strength & Profitability
Evaluating fundamental strength and profitability is crucial to assess the ability to generate returns and maintain dividend payments. The table below highlights the profitability and efficiency ratios:
| Metric | 2022 | 2023 | 2024 |
|---|---|---|---|
| Return on Equity | 13.18% | 12.00% | 17.94% |
| Return on Assets | 2.46% | 2.37% | 3.75% |
| Return on Invested Capital | 2.54% | 2.45% | 3.86% |
| Margins: Net | 7.70% | 7.23% | 10.77% |
| Margins: EBIT | 10.04% | 9.06% | 14.16% |
| Margins: EBITDA | 12.28% | 10.80% | 15.70% |
| Margins: Gross | 23.11% | 21.59% | 26.70% |
| R&D to Revenue | 0% | 0% | 0% |
Strong profitability ratios and efficient capital utilization reinforce The Travelers Companies, Inc.'s capability to fulfill its dividend commitments and maintain operational resilience.
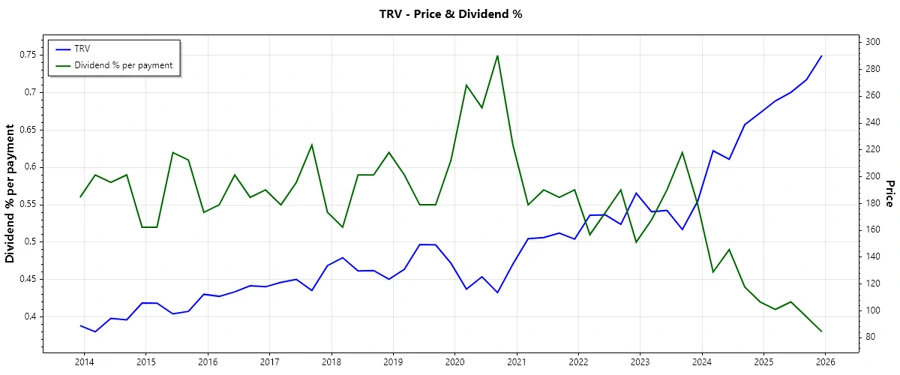
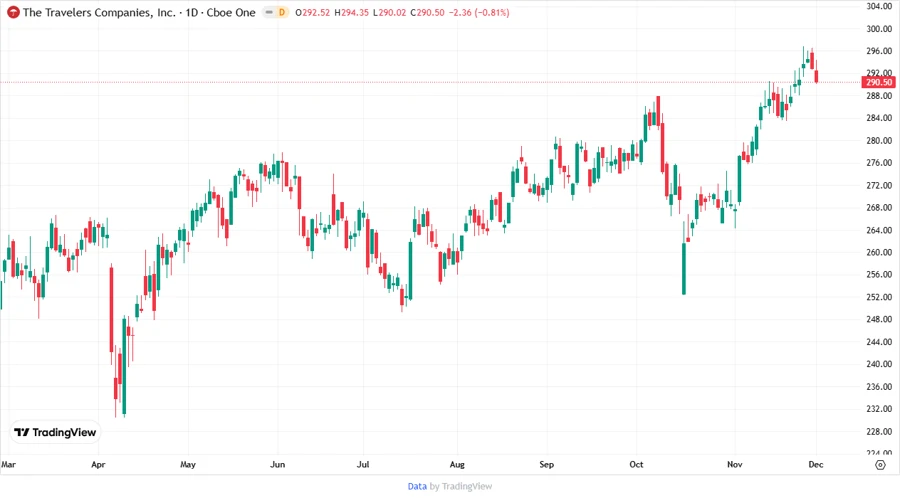
📉 Price Development
🔍 Dividend Scoring System
Using an internal scoring system, The Travelers Companies, Inc. is evaluated across several dividend-related criteria:
| Category | Score | |
|---|---|---|
| Dividend Yield | 3 | |
| Dividend Stability | 5 | |
| Dividend Growth | 4 | |
| Payout Ratio | 5 | |
| Financial Stability | 5 | |
| Dividend Continuity | 5 | |
| Cashflow Coverage | 5 | |
| Balance Sheet Quality | 5 |
Total Score: 37/40
🗒️ Rating
The overall assessment of The Travelers Companies, Inc. places it as a robust candidate for dividend-seeking investors. The company demonstrates enduring financial stability, consistent dividend growth, and efficient operations, supporting a 'Buy' recommendation for stable, long-term income generation.