November 17, 2025 a 03:31 am

TRV: Dividend Analysis - The Travelers Companies, Inc.
The Travelers Companies, Inc. continues to be a reliable dividend payer, boasting a steady history of dividend payments over 41 years. With a recent yield of 1.51%, the company's conservative payout ratios suggest room for future growth. This stability is supplemented by a consistent history of no cuts or suspensions since 2005, portraying it as a solid choice for income-seeking investors.
📊 Overview
The Travelers Companies, Inc. operates within the insurance sector, providing a stable yet modest dividend yield of 1.51%. The current dividend per share stands at $4.17, backed by a notable 41-year history of uninterrupted payments, with the last suspension recorded in 2005. This impressive track record underlines the company's commitment to returning value to shareholders.
| Parameter | Detail |
|---|---|
| Sector | Insurance |
| Dividend Yield | 1.51% |
| Current Dividend Per Share | $4.17 |
| Dividend History | 41 years |
| Last Cut or Suspension | 2005 |
📉 Dividend History
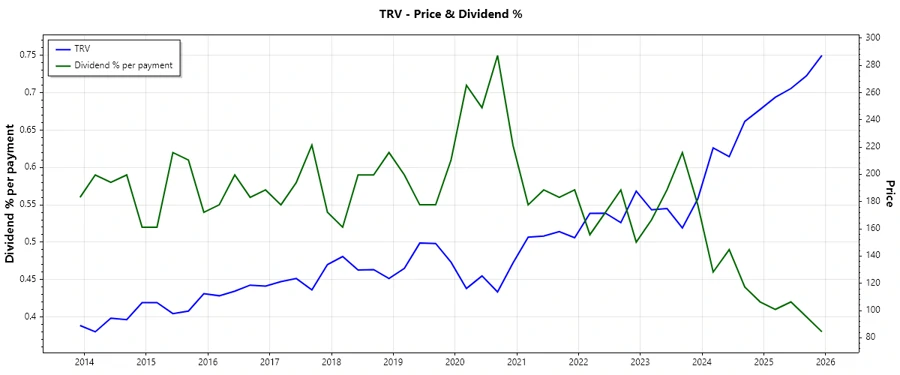
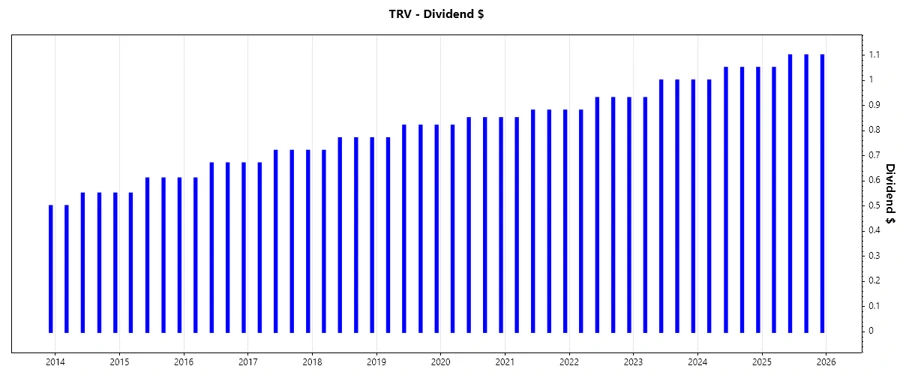
Examining the dividend history reveals a consistent increase in dividends, emphasizing the company's strong commitment towards shareholder returns. This history not only underpins the financial health but also reassures investors about income reliability.
| Year | Dividend Per Share (USD) |
|---|---|
| 2025 | 4.35 |
| 2024 | 4.15 |
| 2023 | 3.93 |
| 2022 | 3.67 |
| 2021 | 3.49 |
📈 Dividend Growth
The gradual increase in dividends is a key indicator of a company's financial robustness. Travelers boasts a 5-year dividend growth of 5.14%, showcasing the potential for sustainable income growth for investors.
| Time | Growth |
|---|---|
| 3 years | 5.94% |
| 5 years | 5.14% |
The average dividend growth is 5.14% over 5 years. This shows moderate but steady dividend growth.
✅ Payout Ratio
The payout ratio is a crucial measure of dividend sustainability. Travelers maintains a low EPS-based payout ratio of 15.91% and an even lower FCF-based ratio of 9.44%, reflecting a prudent approach to dividend distribution and ample room for increases.
| Key Figure | Ratio |
|---|---|
| EPS-based | 15.91% |
| Free cash flow-based | 9.44% |
The EPS and FCF payout ratios are low, suggesting a sustainable dividend payment with potential for future increases.
🗣️ Cashflow & Capital Efficiency
Assessing cashflow metrics is essential for understanding a company's capital efficiency and its ability to support dividend payouts. Consistent free cash flow and efficient use of operating cash strengthen the financial backbone of Travelers.
| Metric | 2024 | 2023 | 2022 |
|---|---|---|---|
| Free Cash Flow Yield | 16.52% | 17.62% | 14.55% |
| Earnings Yield | 9.10% | 6.84% | 6.40% |
| CAPEX to Operating Cash Flow | 0 | 0 | 0 |
| Stock-based Compensation to Revenue | 0 | 0 | 0 |
| Free Cash Flow / Operating Cash Flow Ratio | 100% | 100% | 100% |
The cashflow metrics indicate strong capital efficiency and positive free cash flow support, highlighting Travelers' capability to handle dividends and reinvestments effectively.
🗣️ Balance Sheet & Leverage Analysis
A healthy balance sheet with strong leverage figures is critical for ensuring financial stability and the company's capability to meet its long-term obligations. Travelers showcases sound debt management.
| Metric | 2024 | 2023 | 2022 |
|---|---|---|---|
| Debt-to-Equity | 0.29 | 0.32 | 0.34 |
| Debt-to-Assets | 0.06 | 0.06 | 0.06 |
| Debt-to-Capital | 0.22 | 0.24 | 0.25 |
| Net Debt to EBITDA | 1.01 | 1.65 | 1.43 |
| Current Ratio | N/A | N/A | N/A |
| Quick Ratio | 29.33 | 27.38 | 23.58 |
| Financial Leverage | 4.78 | 5.06 | 5.37 |
The leverage analysis illustrates Travelers' manageable debt levels, maintaining financial flexibility while upholding dividend obligations.
🗣️ Fundamental Strength & Profitability
Fundamental strength and profitability indicators support a company's operational efficacy and competitiveness in the industry, ensuring long-term value creation.
| Metric | 2024 | 2023 | 2022 |
|---|---|---|---|
| Return on Equity | 17.94% | 12.00% | 13.18% |
| Return on Assets | 3.75% | 2.37% | 2.46% |
| Margins: Net | 10.77% | 7.23% | 7.70% |
| Margins: EBIT | 14.16% | 9.06% | 10.04% |
| Margins: EBITDA | 15.70% | 10.80% | 12.28% |
| Margins: Gross | 26.70% | 21.59% | 23.11% |
| R&D to Revenue | N/A | N/A | N/A |
These profitability metrics showcase Travelers' effective asset utilization and strong operational margins, sustaining dividend capacity and growth potential.
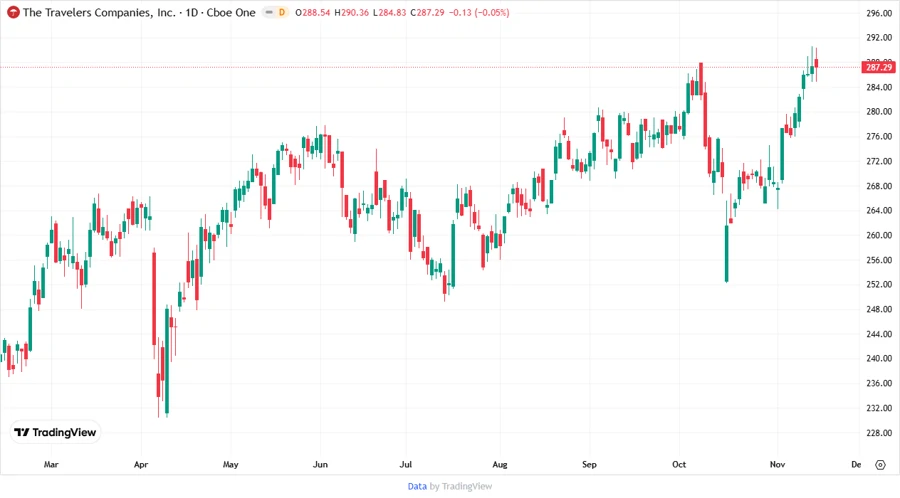
📈 Price Development
📊 Dividend Scoring System
| Factor | Score | Score Bar |
|---|---|---|
| Dividend Yield | 3 | |
| Dividend Stability | 5 | |
| Dividend Growth | 4 | |
| Payout Ratio | 5 | |
| Financial Stability | 4 | |
| Dividend Continuity | 5 | |
| Cashflow Coverage | 4 | |
| Balance Sheet Quality | 4 |
Total Score: 34/40
🗣️ Rating
Based on a comprehensive analysis of Travelers' financials and dividend metrics, the company scores highly on dividend stability and payout affordability. With robust cash flows and sound balance sheet, it stands as a strong candidate for investors seeking reliable income with moderate growth prospects.
Smart Data Insight
Master the Perfect Entry & Exit for this Stock
Don't leave your profits to chance. Historically, this stock follows specific seasonal patterns that institutional traders use to maximize returns.
- ✅ Identify the "Golden Buying Window"
- ✅ Avoid high-risk correction cycles
- ✅ Backtested data from the last 20+ years