April 29, 2026 a 04:03 am

TROW: Trend and Support & Resistance Analysis - T. Rowe Price Group, Inc.
T. Rowe Price Group, Inc. shows a mixed financial trajectory over the recent months, influenced by global market conditions and its strategic initiatives in socially responsible investing. The firm's focus on both equity and fixed income mutual funds continues to sustain its relevance in the investment community. Historically rich in its foundations and diverse in market approach, the stock provides moderate growth potential while navigating through financial volatility.
Trend Analysis
| Date | Closing Price | Trend |
|---|---|---|
| 2026-04-28 | 100.77 | ▲ |
| 2026-04-27 | 101.36 | ▲ |
| 2026-04-24 | 99.06 | ▼ |
| 2026-04-23 | 99.49 | ▼ |
| 2026-04-22 | 100.24 | ▲ |
| 2026-04-21 | 99.14 | ▼ |
| 2026-04-20 | 98.10 | ▼ |
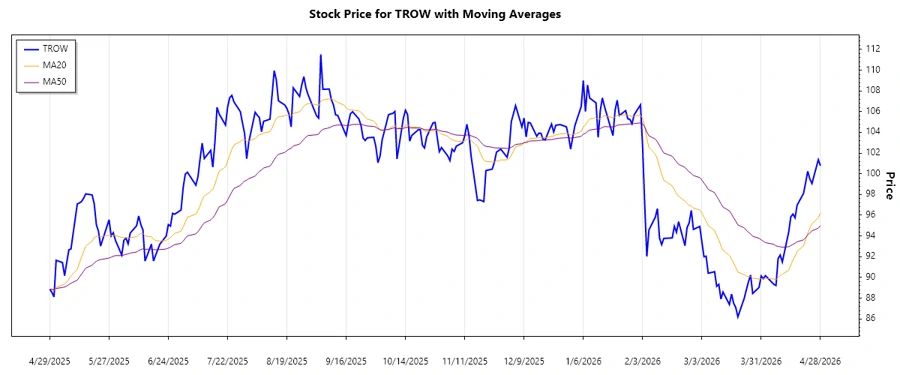
The analysis shows a recent upward trend where the EMA20 surpasses the EMA50, indicating a positive outlook. Investors might perceive this as a potential entry point, depending on broader market conditions.
Support- and Resistance
| Zone Type | From | To |
|---|---|---|
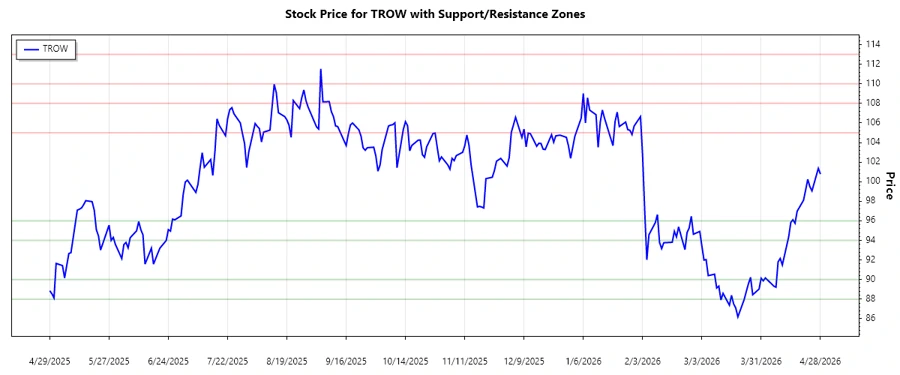
| Resistance | 105.00 | 108.00 |
| Resistance | 110.00 | 113.00 |
| Support | 94.00 | 96.00 |
| Support | 88.00 | 90.00 |
The current trading price is hovering near the upper support zone, indicating potential buying interest. Should the price maintain above this, a further test of resistance levels is anticipated.
Conclusion
T. Rowe Price Group, Inc. presents a balanced opportunity with recent indications of an upward trend supported by technical analyses. The existence of well-defined support and resistance zones offers traders clear points for potential entry or exit. However, volatility in broader market conditions could impact these trajectories, necessitating careful monitoring. Investment strategies should align with personal risk tolerance levels, considering the potential for both growth and fluctuation. For technical analysts, the interplay between EMA levels and support/resistance zones provides a framework for strategic decision-making.