
July 18, 2026 a 07:43 am

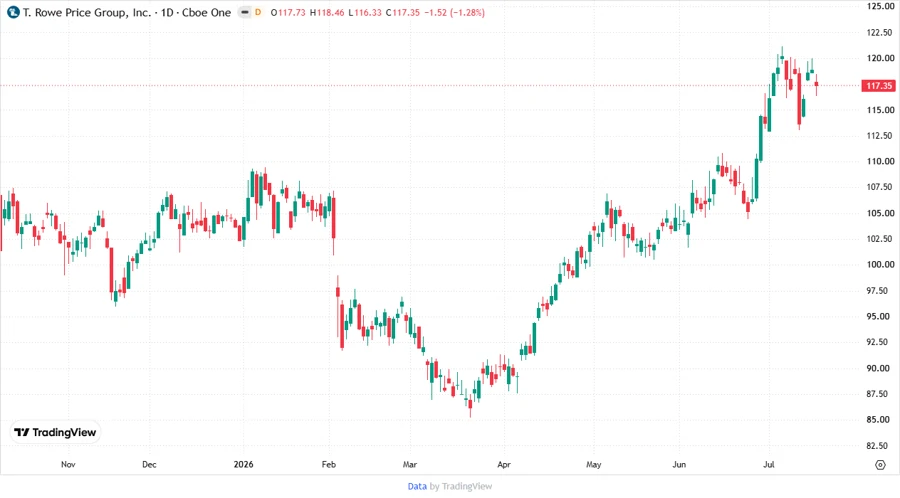
TROW: Fundamental Ratio Analysis - T. Rowe Price Group, Inc.
T. Rowe Price Group, Inc., a leader in investment management, offers a well-diversified portfolio and solid track record in financial stewardship. Their commitment to socially responsible investing, alongside a strong global presence, ensures resilience in varying market conditions. The stock remains a steady choice for investors seeking long-term value.
Fundamental Rating
T. Rowe Price Group, Inc. has received a solid 'A' rating in fundamentals, suggesting strong financial health and investment potential.
| Category | Score | Visualization |
|---|---|---|
| Discounted Cash Flow | 4 | |
| Return on Equity | 5 | |
| Return on Assets | 5 | |
| Debt to Equity | 4 | |
| Price to Earnings | 3 | |
| Price to Book | 2 |
Historical Rating
Examining the historical ratings indicates consistent performance with slight improvements over time.
| Date | Overall | DCF | ROE | ROA | D/E | P/E | P/B |
|---|---|---|---|---|---|---|---|
| 2026-07-17 | 4 | 4 | 5 | 5 | 4 | 3 | 2 |
Analyst Price Targets
The current analyst price target consensus suggests a stable outlook for T. Rowe Price Group, Inc.
| High | Low | Median | Consensus |
|---|---|---|---|
| $121 | $98 | $109 | $109.2 |
Analyst Sentiment
Analysts exhibit a predominantly 'Hold' sentiment, reflecting a cautious but stable outlook.
| Recommendation | Count | Visualization |
|---|---|---|
| Strong Buy | 0 | |
| Buy | 8 | |
| Hold | 24 | |
| Sell | 6 | |
| Strong Sell | 0 |
Conclusion
T. Rowe Price Group, Inc. stands as a robust option in the asset management sector due to its solid fundamentals and strong focus on ESG. The historical consistency in performance and broad geographic presence further bolster its appeal. Despite a cautious sentiment among analysts, the stable investment ratings suggest minimal downside risk. Future growth prospects remain healthy given the firm's commitment to innovation and responsible investing. However, potential investors should be mindful of market volatility and sectoral changes impacting financial services.
Smart Data Insight
Master the Perfect Entry & Exit for this Stock
Don't leave your profits to chance. Historically, this stock follows specific seasonal patterns that institutional traders use to maximize returns.
- ✅ Identify the "Golden Buying Window"
- ✅ Avoid high-risk correction cycles
- ✅ Backtested data from the last 20+ years