May 10, 2026 a 11:44 am
TROW: Fibonacci Analysis - T. Rowe Price Group, Inc.
T. Rowe Price Group, Inc. (TROW) has exhibited remarkable resilience and growth in recent months, culminating in a notable uptrend. The firm's focus on socially responsible investing, along with its strong global presence, offers it a competitive advantage. Given the robust performance, TROW remains an attractive option for investors looking for exposure to the investment management sector.
Fibonacci Analysis
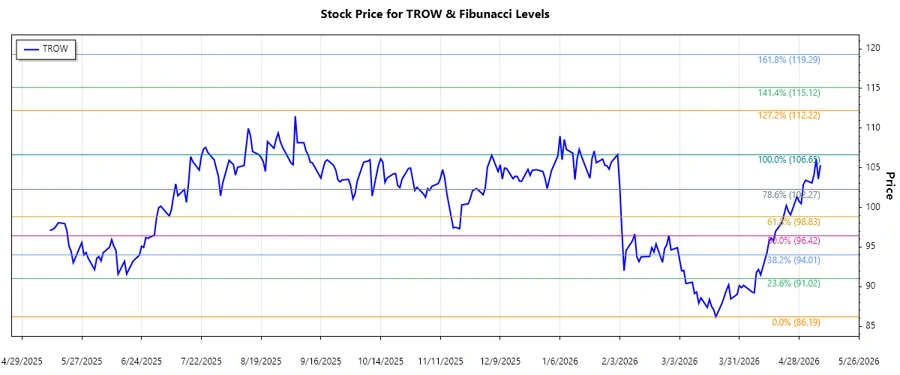
The analysis of TROW's stock data over the past few months reveals a dominant uptrend. From March 17th, 2026, to May 8th, 2026, the stock demonstrated significant upward momentum.
| Detail | Value |
|---|---|
| Start Date | 2026-03-17 |
| End Date | 2026-05-08 |
| High Point | $106.65 on 2026-02-02 |
| Low Point | $86.19 on 2026-03-20 |
Fibonacci Retracement Levels
| Level | Price |
|---|---|
| 0.236 | $95.89 |
| 0.382 | $92.88 |
| 0.5 | $90.92 |
| 0.618 | $88.95 |
| 0.786 | $86.69 |
The current price of $105.33 is currently above all Fibonacci retracement levels, suggesting that the stock is experiencing strong support. The most recent retracement zone of significance was around the 0.236 level at $95.89, which acted as a potential support.
Technically, the stock has breached previous resistance levels and is poised for potential further upward movements, possibly targeting new highs.
Conclusion
T. Rowe Price Group, Inc. has shown robust upward momentum, reaffirming its resilience in a volatile market. With a strong financial backbone, the company is well-positioned to capitalize on investment trends, particularly those focused on ESG factors. Despite market uncertainties, TROW's commitment to fundamental and quantitative analysis provides a strategic advantage. Risks remain in global market fluctuations and competitive pressures, but opportunities in expanding footprint and strategic investments present a promising outlook for continued growth. Analysts should monitor retracement levels as potential buying opportunities in any corrections that might occur.
Smart Data Insight
Master the Perfect Entry & Exit for this Stock
Don't leave your profits to chance. Historically, this stock follows specific seasonal patterns that institutional traders use to maximize returns.
- ✅ Identify the "Golden Buying Window"
- ✅ Avoid high-risk correction cycles
- ✅ Backtested data from the last 20+ years