February 25, 2026 a 04:44 pm

TROW: Fibonacci Analysis - T. Rowe Price Group, Inc.
T. Rowe Price Group, Inc. has shown a significant decline in its stock price over the past months, reflecting potential challenges in its market environment. Investors should exercise caution and pay close attention to technical indicators that might suggest potential reversals or continued bearish sentiment. The company's commitment to socially responsible investing remains a key differentiator amidst turbulent market conditions.
Fibonacci Analysis
| Detail | Information |
|---|---|
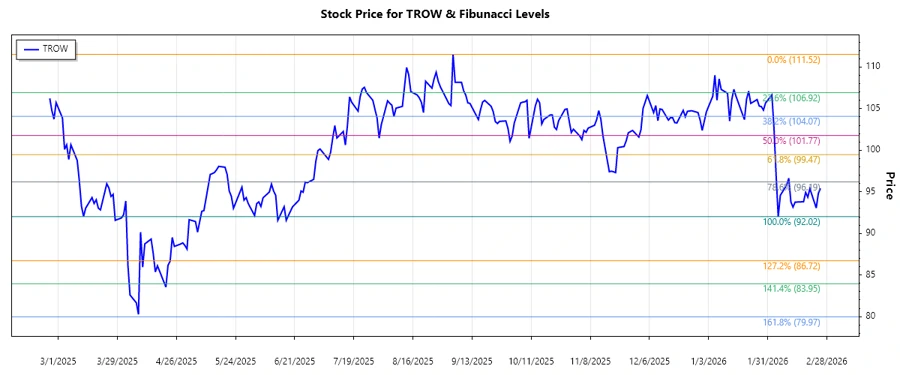
| Trend Duration | 2025-09-04 to 2026-02-25 |
| High Point | $111.52 on 2025-09-04 |
| Low Point | $92.02 on 2026-02-05 |
| Fibonacci Level | Price Level |
|---|---|
| 0.236 | $96.85 |
| 0.382 | $98.80 |
| 0.5 | $101.77 |
| 0.618 | $104.74 |
| 0.786 | $108.16 |
The current price of $95.42 positions it between the 0.236 and 0.5 Fibonacci retracement levels, indicating potential support at these levels. This suggests a possible rebound, though vigilance for further bearish moves is advisable.
Technical interpretation indicates possible support around the 0.236 level, though breaking below could activate more selling pressure.
Conclusion
T. Rowe Price Group, Inc. faces a challenging period as reflected by the recent downtrend, but opportunities may arise if the stock finds support at current Fibonacci levels. While technical indicators suggest potential support, broader market conditions and company-specific fundamentals should not be ignored. Analysts should watch for signs of stabilization before taking long positions, and remain cautious as a break below key retracement levels could indicate further declines. This analysis provides a technical framework within which to evaluate TROW's potential recovery or continuation downward.