September 13, 2025 a 07:47 am


TROW: Dividend Analysis - T. Rowe Price Group, Inc.
T. Rowe Price Group, Inc. offers a robust dividend profile with a compelling dividend yield of 4.78%. The company boasts an impressive 40-year history of dividends without any cuts or suspensions, highlighting its commitment to returning capital to shareholders. However, slight challenges in recent growth metrics may indicate areas to watch for future performance.
📊 Overview
Analyzing key dividend metrics provides insights into T. Rowe Price's financial health and shareholder return potential.
| Metric | Value |
|---|---|
| Sector | Financial Services |
| Dividend yield | 4.78% |
| Current dividend per share | 5.10 USD |
| Dividend history | 40 years |
| Last cut or suspension | None |
📈 Dividend History
The dividend history of T. Rowe Price shows consistent payments over the years, highlighting its dedication to rewarding shareholders.
| Year | Dividend per Share (USD) |
|---|---|
| 2025 | 3.81 |
| 2024 | 4.96 |
| 2023 | 4.88 |
| 2022 | 4.80 |
| 2021 | 7.32 |
📈 Dividend Growth
Despite recent negative growth over three years, the five-year trend suggests moderate growth in dividends, emphasizing stability in shareholder returns.
| Time | Growth |
|---|---|
| 3 years | -0.12% |
| 5 years | 10.29% |
The average dividend growth is 10.29% over 5 years. This shows moderate but steady dividend growth.
📉 Payout Ratio
Payout ratios indicate how well T. Rowe Price covers dividend payments with earnings and free cash flow, which is critical for sustainability.
| Key figure | Ratio |
|---|---|
| EPS-based | 55.05% |
| Free cash flow-based | 85.11% |
An EPS-based payout ratio of 55.05% and a free cash flow-based ratio of 85.11% suggest a reasonable cushion for dividend sustainability, though the latter may require monitoring.
💼 Cashflow & Capital Efficiency
T. Rowe Price's cash flow metrics reflect its operational efficiency and capability to sustain dividends. High capital efficiency ratios further signify robust company performance.
| Year | 2024 | 2023 | 2022 |
|---|---|---|---|
| Free Cash Flow Yield | 5.009% | 3.776% | 8.609% |
| Earnings Yield | 8.335% | 7.412% | 6.321% |
| CAPEX to Op. Cash Flow | 14.19% | 25.26% | 10.07% |
| Stock Comp. to Revenue | 3.49% | 4.11% | 4.40% |
| Free Cash Flow / Op. Cash Flow Ratio | 74.88% | 74.74% | 89.93% |
The figures indicate solid cash flow health and capital efficiency, crucial for dividend sustainability and operational agility.
📊 Balance Sheet & Leverage Analysis
A critical examination of leverage ratios reveals T. Rowe Price's capacity to manage debt while maintaining strong liquidity.
| Year | 2024 | 2023 | 2022 |
|---|---|---|---|
| Debt-to-Equity | 2.69% | 3.25% | 3.73% |
| Debt-to-Assets | 2.07% | 2.51% | 2.83% |
| Debt-to-Capital | 2.62% | 3.14% | 3.59% |
| Net Debt to EBITDA | -0.80 | -0.70 | -0.45 |
| Current Ratio | 8.00 | 5.88 | 5.53 |
| Quick Ratio | 8.00 | 5.88 | 5.53 |
| Financial Leverage | 1.30 | 1.29 | 1.32 |
These metrics illustrate excellent financial management, ensuring liquidity and low reliance on debt.
🗣️ Fundamental Strength & Profitability
An assessment of profitability ratios demonstrates T. Rowe Price’s capacity to generate sustainable returns and maintain competitive operating margins.
| Year | 2024 | 2023 | 2022 |
|---|---|---|---|
| Return on Equity | 20.30% | 18.82% | 17.62% |
| Return on Assets | 15.59% | 14.57% | 13.38% |
| Net Margin | 29.61% | 27.69% | 24.01% |
| EBIT Margin | 34.91% | 31.55% | 38.47% |
| EBITDA Margin | 42.02% | 39.00% | 48.42% |
| Gross Margin | 51.94% | 49.63% | 54.96% |
| R&D to Revenue | 0% | 0% | 0% |
These indicators stress strong profitability, supporting both continued investments and dividends.
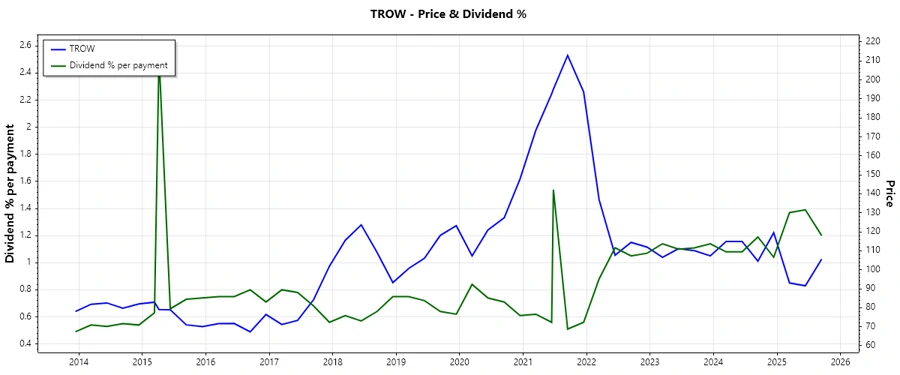
📉 Price Development
🏆 Dividend Scoring System
| Category | Score | Visual |
|---|---|---|
| Dividend yield | 4 | |
| Dividend Stability | 5 | |
| Dividend growth | 3 | |
| Payout ratio | 4 | |
| Financial stability | 5 | |
| Dividend continuity | 5 | |
| Cashflow Coverage | 4 | |
| Balance Sheet Quality | 5 |
Overall Score: 35/40
✅ Rating
T. Rowe Price Group, Inc. demonstrates a strong dividend and financial profile, bolstering a strong recommendation for income-focused investors. Its combination of yield, stability, and prudent financial management makes it a compelling addition to any dividend-focused portfolio.
Smart Data Insight
Master the Perfect Entry & Exit for this Stock
Don't leave your profits to chance. Historically, this stock follows specific seasonal patterns that institutional traders use to maximize returns.
- ✅ Identify the "Golden Buying Window"
- ✅ Avoid high-risk correction cycles
- ✅ Backtested data from the last 20+ years