July 25, 2025 a 03:31 am

TROW: Dividend Analysis - T. Rowe Price Group, Inc.
T. Rowe Price Group, Inc. stands out with a significant dividend yield of 5.48%, reflecting its firm commitment to returning value to shareholders. Its 40-year consistent dividend payment history demonstrates strong reliability, though recent figures indicate a moderate growth over the past five years. Vigilant monitoring of payout ratios is advised as both EPS and FCF-based ratios are noticeably high.
📊 Overview
T. Rowe Price Group operates within the financial sector, offering a significant dividend yield of 5.48%. The company's current dividend per share stands at $5.09, boasting an impressive 40-year dividend history. Importantly, there have been no recent dividend cuts or suspensions, signaling robust financial health.
| Detail | Value |
|---|---|
| Sector | Financial |
| Dividend yield | 5.48% |
| Current dividend per share | 5.09 USD |
| Dividend history | 40 years |
| Last cut or suspension | None |
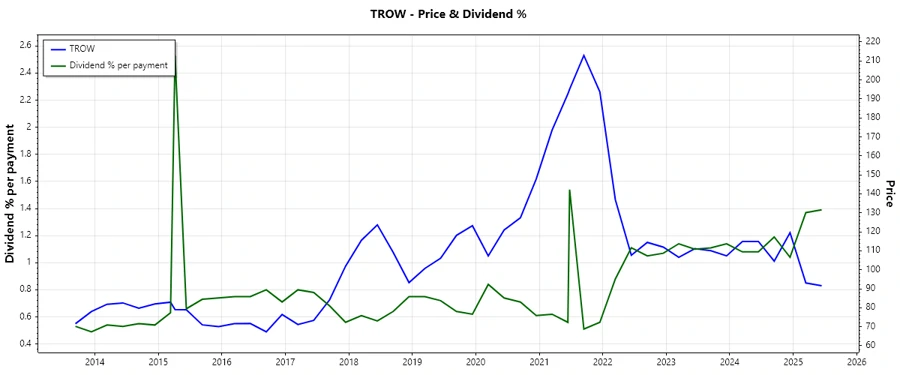
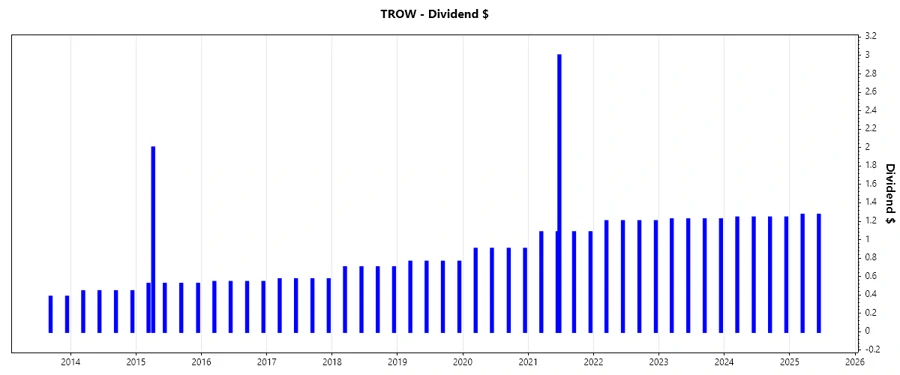
🗣️ Dividend History
The dividend history of T. Rowe Price Group reflects a resilient and growth-oriented strategy. A 40-year dividend payment streak illustrates sustainability and strength, crucial for income-focused investors.
| Year | Dividend per Share (USD) |
|---|---|
| 2025 | 2.54 |
| 2024 | 4.96 |
| 2023 | 4.88 |
| 2022 | 4.80 |
| 2021 | 7.32 |
📈 Dividend Growth
Dividend growth is a critical indicator of a company's evolving financial strength. Over the past 3 years, growth has slightly retracted, but a 5-year horizon shows a marginal increase, emphasizing stable but measured expansion.
| Time | Growth |
|---|---|
| 3 years | -0.12% |
| 5 years | 10.29% |
The average dividend growth is 10.29% over 5 years. This shows moderate but steady dividend growth.
📉 Payout Ratio
Analyzing payout ratios helps assess the sustainability of dividends. With a current EPS-based payout ratio at 56.63% and FCF-based ratio at 83.74%, the company appears committed to shareholder returns, yet caution is needed due to high FCF allocation.
| Key figure ratio | Value |
|---|---|
| EPS-based | 56.63% |
| Free cash flow-based | 83.74% |
While the EPS payout seems manageable, the FCF-based ratio suggests caution, as allocating a large portion of cash flow to dividends may limit other financial operations.
✅ Cashflow & Capital Efficiency
Sustainable free cash flow and efficient capital management are vital for maintaining attractive dividend policies and business growth. Below are key financial metrics emphasizing T. Rowe Price's cash flow stability and capital efficiency over recent years.
| Metric | 2024 | 2023 | 2022 |
|---|---|---|---|
| Free Cash Flow Yield | 5.00% | 3.78% | 8.61% |
| Earnings Yield | 8.32% | 7.41% | 6.32% |
| CAPEX to Operating Cash Flow | 25.12% | 25.26% | 10.07% |
| Stock-based Compensation to Revenue | 3.49% | 4.11% | 4.40% |
| Free Cash Flow / Operating Cash Flow Ratio | 74.88% | 74.74% | 89.93% |
Mature free cash flow yields and moderate CAPEX expenditures highlight sound cash flow management, supporting steady dividend policies.
📊 Balance Sheet & Leverage Analysis
The financial stability and leverage of a company are critical for assessing its ability to sustain dividends during economic turmoils and take advantage of growth opportunities.
| Metric | 2024 | 2023 | 2022 |
|---|---|---|---|
| Debt-to-Equity | 2.69% | 4.19% | 3.73% |
| Debt-to-Assets | 2.07% | 3.24% | 2.83% |
| Debt-to-Capital | 2.62% | 4.02% | 3.59% |
| Net Debt to EBITDA | -1.02 | -0.66 | -0.56 |
| Current Ratio | 8.01 | 5.88 | 5.53 |
| Quick Ratio | 8.01 | 5.88 | 5.53 |
| Financial Leverage | 1.30 | 1.29 | 1.32 |
The remarkable low leverage ratios and high liquidity ratios underpin the company's superb financial health, ensuring its ability to weather adversity and continue its dividend payments.
📈 Fundamental Strength & Profitability
Understanding a company's fundamental strength and profitability helps in determining its long-term viability and potential for dividend growth.
| Metric | 2024 | 2023 | 2022 |
|---|---|---|---|
| Return on Equity | 20.30% | 18.82% | 17.62% |
| Return on Assets | 15.59% | 14.57% | 13.38% |
| Margins: Net | 29.61% | 27.69% | 24.01% |
| Margins: EBIT | 34.91% | 31.55% | 38.47% |
| Margins: EBITDA | 32.89% | 39.41% | 39.06% |
| Gross Margins | 51.94% | 49.63% | 54.96% |
| Research & Development to Revenue | 0% | 0% | 0% |
The high returns on equity and assets, alongside sturdy profit margins, corroborate T. Rowe Price's competitive edge and operational excellence.
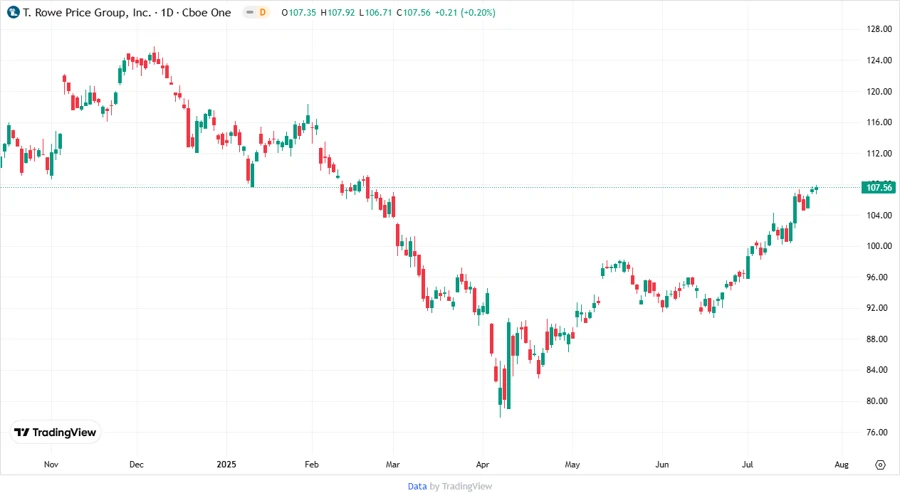
📉 Price Development
Dividend Scoring System
| Criteria | Score | |
|---|---|---|
| Dividend yield | 5 | |
| Dividend Stability | 5 | |
| Dividend growth | 3 | |
| Payout ratio | 3 | |
| Financial stability | 4 | |
| Dividend continuity | 5 | |
| Cashflow Coverage | 4 | |
| Balance Sheet Quality | 5 |
Total Score: 34/40
Rating
Overall, T. Rowe Price Group, Inc. earns a robust rating, thanks to its exceptional dividend continuity and yield, alongside strong financial stability and profitability. Despite a moderate growth rate, it's an excellent choice for income-seeking investors. Continuous evaluation of payout ratios is advised to ensure long-term dividend sustainability without compromising company growth objectives.
Smart Data Insight
Master the Perfect Entry & Exit for this Stock
Don't leave your profits to chance. Historically, this stock follows specific seasonal patterns that institutional traders use to maximize returns.
- ✅ Identify the "Golden Buying Window"
- ✅ Avoid high-risk correction cycles
- ✅ Backtested data from the last 20+ years