July 05, 2025 a 12:46 pm

TROW: Dividend Analysis - T. Rowe Price Group, Inc.
T. Rowe Price Group, Inc. exhibits a robust dividend profile with a current dividend yield of 5.48%. The company's long-standing history of dividend payouts for 40 consecutive years suggests reliability, though recent shifts in dividend growth require scrutiny. Strategic evaluation reveals a moderate payout ratio backed by solid financial underpinning, signifying a potentially attractive opportunity for income-focused investors.
Overview
Detailed assessment of T. Rowe Price Group’s dividend metrics suggests a sound investment outlook, with stable dividend payments supported by substantial market cap and sector resilience.
| Sector | Dividend Yield | Current Dividend per Share | Dividend History | Last Cut/Suspension |
|---|---|---|---|---|
| Financial Services | 5.48 % | 5.09 USD | 40 years | None |
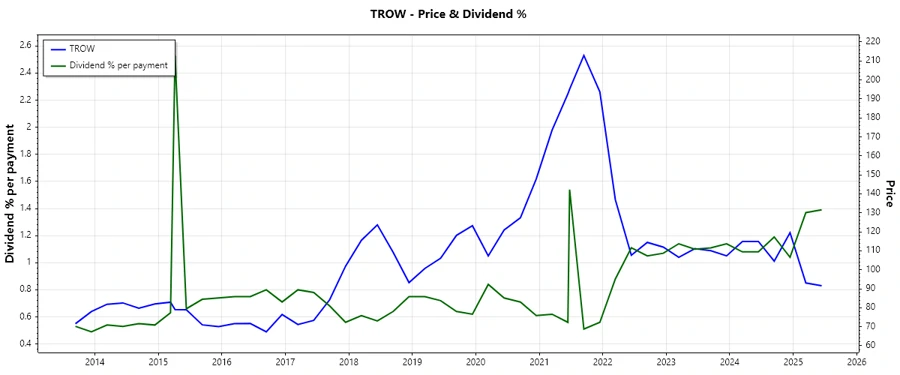
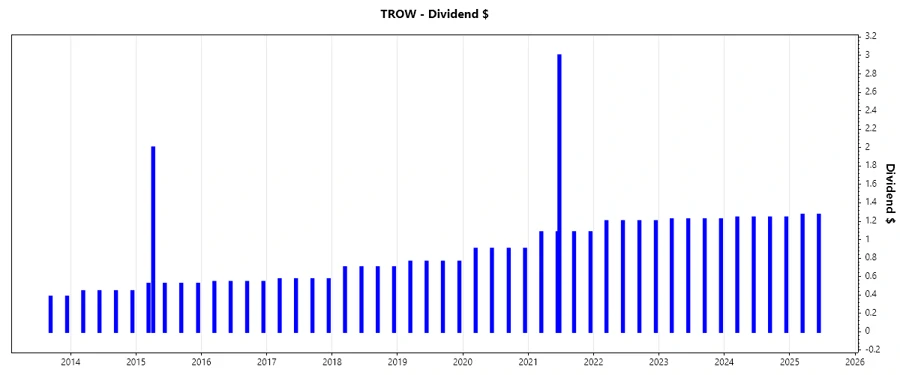
Dividend History
The company's 40-year track record of dividend payments underscores its commitment to shareholder returns, making it a staple for long-term income-oriented portfolios.
| Year | Dividend Per Share (USD) |
|---|---|
| 2025 | 2.54 |
| 2024 | 4.96 |
| 2023 | 4.88 |
| 2022 | 4.80 |
| 2021 | 7.32 |
Dividend Growth
Analyzing the dividend growth provides insights into the company's ability to enhance shareholder value over time. The moderate reduction in 3-year growth is noteworthy, requiring consideration in investment evaluations.
| Time | Growth |
|---|---|
| 3 years | -0.12% |
| 5 years | 10.29% |
The average dividend growth is 10.29% over 5 years. This shows moderate but steady dividend growth.
Payout Ratio
The payout ratio is a critical indicator of a company’s sustainability in maintaining its dividend payments. T. Rowe Price’s figures reflect a healthy balance between distributing profits and retaining earnings.
| Key figure | Ratio |
|---|---|
| EPS-based | 56.63 % |
| Free cash flow-based | 83.74 % |
The EPS-based ratio of 56.63% and FCF-based ratio of 83.74% suggest that the company's current dividend payouts are sustainable given its earnings and cash flow generation, albeit with a cautious eye on maintaining cash flow coverage.
Cashflow & Capital Efficiency
Evaluating the cash flow and capital efficiency metrics is essential for understanding the company's operational prowess and ability to fund dividends and growth initiatives.
| Metric | 2024 | 2023 | 2022 |
|---|---|---|---|
| Free Cash Flow Yield | 5.00% | 3.78% | 8.61% |
| Earnings Yield | 8.32% | 7.41% | 6.32% |
| CAPEX to Operating Cash Flow | 25.12% | 25.26% | 10.07% |
| Stock-based Compensation to Revenue | 3.49% | 4.11% | 4.40% |
| Free Cash Flow / Operating Cash Flow Ratio | 74.88% | 74.74% | 89.93% |
The analysis reveals a stable free cash flow generation with a consistent earnings yield. While the increase in stock-based compensation warrants attention, overall cash flow supports capital distribution strategies.
Balance Sheet & Leverage Analysis
A robust balance sheet with minimal leverage enhances financial flexibility, allowing for continued investment in growth and sustaining dividend policies.
| Metric | 2024 | 2023 | 2022 |
|---|---|---|---|
| Debt-to-Equity | 2.69% | 4.19% | 3.73% |
| Debt-to-Assets | 2.07% | 3.24% | 2.83% |
| Debt-to-Capital | 2.62% | 4.02% | 3.59% |
| Net Debt to EBITDA | -1.02 | -0.66 | -0.56 |
| Current Ratio | 8.01 | 5.88 | 5.53 |
| Quick Ratio | 8.01 | 5.88 | 5.53 |
| Financial Leverage | 1.30 | 1.29 | 1.32 |
The balance sheet exhibits strong liquidity and conservative leverage, evidenced by a current ratio significantly above industry norms and minimal debt utilization.
Fundamental Strength & Profitability
Fundamental strength is crucial for sustaining growth and delivering consistent returns. T. Rowe Price maintains excellent margins and returns, indicative of operational efficiency.
| Metric | 2024 | 2023 | 2022 |
|---|---|---|---|
| Return on Equity | 20.30% | 18.82% | 17.62% |
| Return on Assets | 15.59% | 14.57% | 13.38% |
| Net Margin | 29.61% | 27.69% | 24.01% |
| EBIT Margin | 34.91% | 31.55% | 38.47% |
| EBITDA Margin | 32.89% | 39.41% | 39.06% |
| Gross Margin | 51.94% | 49.63% | 54.96% |
| R&D to Revenue | 0% | 0% | 0% |
High returns on equity and sustainable margins confirm strong operational control, which is critical for ongoing growth and competitive standing in the financial services sector.
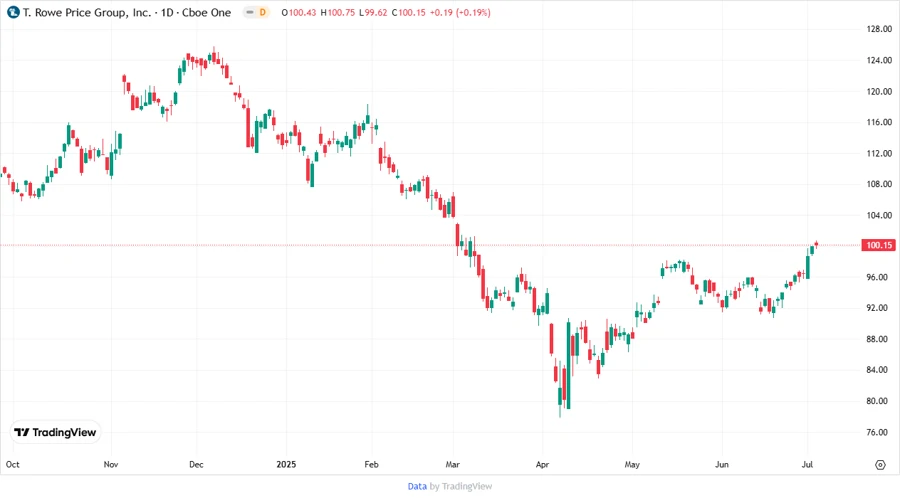
Price Development
Dividend Scoring System
| Category | Score | Score Bar |
|---|---|---|
| Dividend Yield | 4 | |
| Dividend Stability | 5 | |
| Dividend Growth | 3 | |
| Payout Ratio | 3 | |
| Financial Stability | 5 | |
| Dividend Continuity | 5 | |
| Cashflow Coverage | 4 | |
| Balance Sheet Quality | 5 |
Total Score: 34/40
Rating
Based on the comprehensive analysis of T. Rowe Price Group, Inc., the company demonstrates strength in maintaining its dividend commitments, supported by its financial stability and capital efficiency. The rating reflects strong potential for income investors with a solid margin of safety, albeit keeping an eye on future growth prospects due to recent dividend growth trends.
Smart Data Insight
Master the Perfect Entry & Exit for this Stock
Don't leave your profits to chance. Historically, this stock follows specific seasonal patterns that institutional traders use to maximize returns.
- ✅ Identify the "Golden Buying Window"
- ✅ Avoid high-risk correction cycles
- ✅ Backtested data from the last 20+ years