May 29, 2025 a 02:46 am


TROW: Dividend Analysis - T. Rowe Price Group, Inc.
T. Rowe Price Group, Inc. presents an interesting prospect for dividend-focused investors. With a current dividend yield of 5.34% and a consistent dividend history spanning 40 years, the company underscores its commitment to returning value to shareholders. Despite a moderate payout ratio, the stability in its dividend policy is a positive aspect, making it a candidate worth considering.
📊 Overview
T. Rowe Price Group, a prominent entity in the financial sector, offers substantial dividends to its shareholders. Below are the key dividend statistics:
| Metric | Value |
|---|---|
| Sector | Financial Services |
| Dividend yield | 5.34% |
| Current dividend per share | $5.09 USD |
| Dividend history | 40 years |
| Last cut or suspension | None |
🗣️ Dividend History
The dividend history of T. Rowe Price shows a strong commitment to its shareholders with a track record of consistent payments. This stability is crucial for investors seeking regular income. Here is the recent dividend history:
| Year | Dividend per Share (USD) |
|---|---|
| 2025 | $2.54 |
| 2024 | $4.96 |
| 2023 | $4.88 |
| 2022 | $4.80 |
| 2021 | $7.32 |
📈 Dividend Growth
Dividend growth is crucial for maintaining the purchasing power of income derived from dividends in an inflationary environment. Here is the growth overview:
| Time | Growth |
|---|---|
| 3 years | -0.12% |
| 5 years | 10.29% |
The average dividend growth is 10.29% over 5 years. This shows moderate but steady dividend growth.
📉 Payout Ratio
Analyzing payout ratios provides insights into the sustainability of the dividends. Here are the essential ratios:
| Key figure | Ratio |
|---|---|
| EPS-based | 56.63% |
| Free cash flow-based | 83.74% |
The EPS payout ratio of 56.63% is sustainable and indicates a healthy balance between returning profits to shareholders and retaining earnings for growth. A higher FCF ratio of 83.74% warrants monitoring to ensure adequate retained cash for company operations.
🧐 Cashflow & Capital Efficiency
Efficient cash flow management is critical for the financial health and operational sustainability of a company. Here is a detailed view of T. Rowe Price's cash flows:
| Metric | 2024 | 2023 | 2022 |
|---|---|---|---|
| Free Cash Flow Yield | 4.99% | 3.78% | 8.61% |
| Earnings Yield | 8.32% | 7.41% | 6.32% |
| CAPEX to Operating Cash Flow | 25.12% | 25.26% | 10.07% |
| Stock-based Compensation to Revenue | 3.49% | 4.11% | 4.40% |
| Free Cash Flow / Operating Cash Flow Ratio | 74.88% | 74.74% | 89.93% |
The data reflects T. Rowe Price’s strong cash management capabilities which are indicative of its capital efficiency and ability to generate high returns on its cash investments.
📊 Balance Sheet & Leverage Analysis
Understanding a company's leverage and balance sheet quality is crucial for assessing its financial resilience. Here is T. Rowe Price's current standing:
| Metric | 2024 | 2023 | 2022 |
|---|---|---|---|
| Debt-to-Equity | 2.69% | 4.19% | 3.73% |
| Debt-to-Assets | 2.07% | 3.24% | 2.83% |
| Debt-to-Capital | 2.62% | 4.02% | 3.59% |
| Net Debt to EBITDA | -1.02 | -0.66 | -0.56 |
| Current Ratio | 8.01 | 5.88 | 5.53 |
| Quick Ratio | 8.01 | 5.88 | 5.53 |
| Financial Leverage | 1.30 | 1.29 | 1.32 |
T. Rowe Price displays a robust financial position with low leverage ratios, indicating its ability to weather economic downturns with less pressure from debt.
🚀 Fundamental Strength & Profitability
Here is an evaluation of the fundamental strengths and profitability metrics of T. Rowe Price:
| Metric | 2024 | 2023 | 2022 |
|---|---|---|---|
| Return on Equity | 20.30% | 18.82% | 17.62% |
| Return on Assets | 15.59% | 14.57% | 13.38% |
| Margins: Net | 29.61% | 27.69% | 24.01% |
| EBIT Margin | 34.91% | 31.55% | 38.47% |
| EBITDA Margin | 32.89% | 39.41% | 39.06% |
| Gross Margin | 51.94% | 49.63% | 54.96% |
| R&D to Revenue | 0% | 0% | 0% |
T. Rowe Price demonstrates substantial profitability with strong ROE and ROA figures, highlighting its operational efficiency and investor appeal.
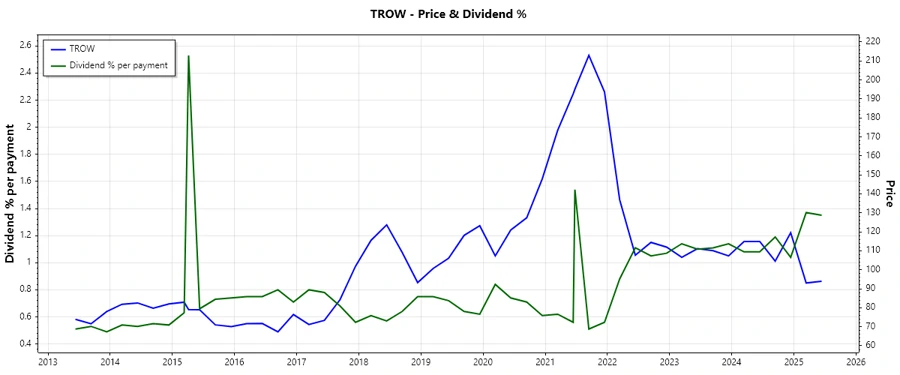
📈 Price Development
🧮 Dividend Scoring System
Here’s our custom dividend scoring system evaluating key factors:
| Category | Score (1-5) | Score Bar |
|---|---|---|
| Dividend Yield | 4 | |
| Dividend Stability | 5 | |
| Dividend Growth | 3 | |
| Payout Ratio | 4 | |
| Financial Stability | 5 | |
| Dividend Continuity | 5 | |
| Cashflow Coverage | 4 | |
| Balance Sheet Quality | 5 |
Overall Score: 35/40
✅ Rating
Based on the analysis, T. Rowe Price Group, Inc. appears to be a strong candidate for investors focusing on dividend yield and stability. The company's robust financial metrics, combined with its consistent track record, suggest it is well-positioned to continue delivering reliable returns to shareholders. While some caution is advised regarding cash flow constraints, the overall outlook remains positive.