
May 26, 2026 a 02:03 pm
TRMB: Trend and Support & Resistance Analysis - Trimble Inc.
Trimble Inc., known for its technological solutions across various segments, has observed fluctuations in its stock performance recently. The analysis focuses on identifying trends and critical support and resistance zones based on the historical price data. An understanding of these dynamics is essential for making informed investment decisions regarding Trimble's stock.
Trend Analysis
| Date | Close Price | Trend |
|---|---|---|
| 26-May-2026 | 56.15 | ▼ Downtrend |
| 22-May-2026 | 56.34 | ▼ Downtrend |
| 21-May-2026 | 55.97 | ▼ Downtrend |
| 20-May-2026 | 55.97 | ▼ Downtrend |
| 19-May-2026 | 54.56 | ▼ Downtrend |
| 18-May-2026 | 55.02 | ▼ Downtrend |
| 15-May-2026 | 55.13 | ▼ Downtrend |
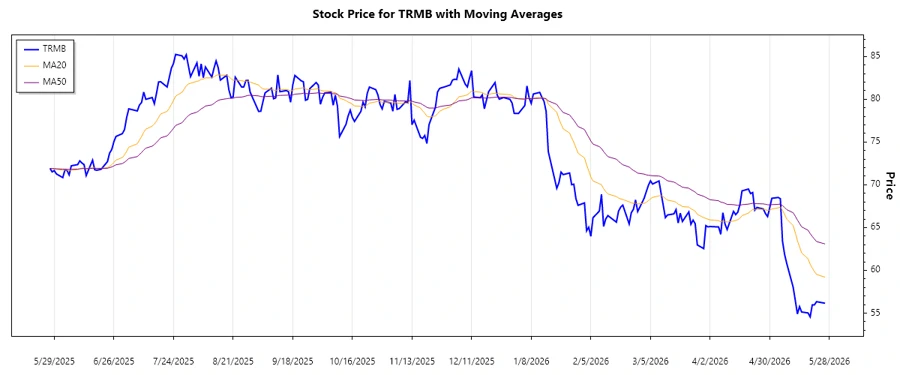
The trend currently indicates a persistent downtrend, with the EMA20 remaining consistently below the EMA50.
Support- and Resistance
| Zone Type | Price Range |
|---|---|
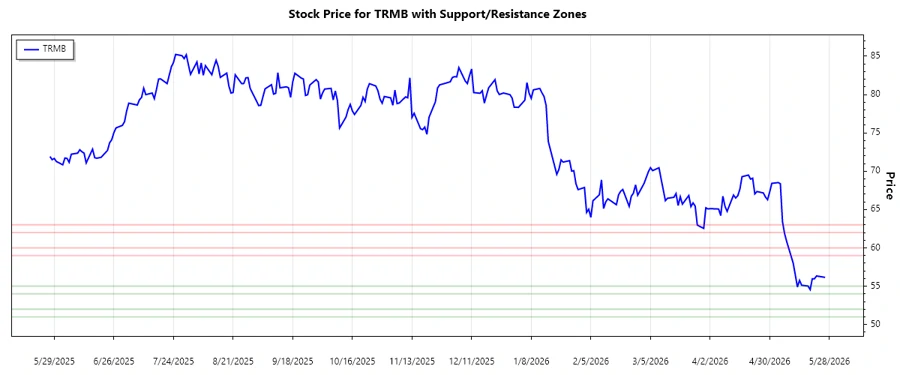
| Support Zone 1 | 54.00 - 55.00 |
| Support Zone 2 | 51.00 - 52.00 |
| Resistance Zone 1 | 59.00 - 60.00 |
| Resistance Zone 2 | 62.00 - 63.00 |
The current price is near the lower support zone, suggesting a critical point which may influence forthcoming market movements.
Conclusion
Trimble Inc. stock is experiencing a downtrend with notable support zones in the mid-50s and potential resistance encountered near 60. The proximity to the lower support zone invites caution as further declines may test investor sentiment. However, with strategic business initiatives, there may come opportunities to capitalize on lower entry points. Those invested should be vigilant of broader market indications and any operational strategy changes by Trimble to assess risks and potential recoveries effectively.
Smart Data Insight
Master the Perfect Entry & Exit for this Stock
Don't leave your profits to chance. Historically, this stock follows specific seasonal patterns that institutional traders use to maximize returns.
- ✅ Identify the "Golden Buying Window"
- ✅ Avoid high-risk correction cycles
- ✅ Backtested data from the last 20+ years