May 18, 2026 a 08:15 am**Aktienanalyse basierend auf den bereitgestellten Daten**

TRMB: Trend and Support & Resistance Analysis - Trimble Inc.
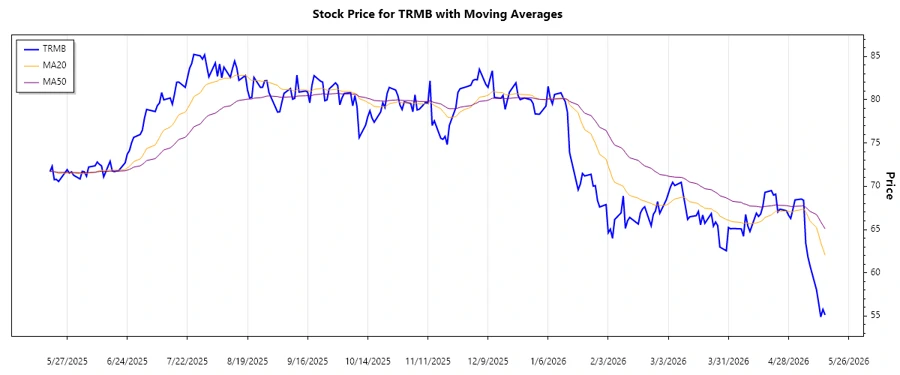
Trimble Inc.'s stock has been recently showing signs of volatility with a notable downward trend. The technological solutions provided by the company remain at the forefront, yet recent market movements suggest a need for cautious optimism. Evaluating the trend and support & resistance levels will provide further insights into potential future price movements.
Trend Analysis
| Date | Closing Price | Trend |
|---|---|---|
| 2026-05-15 | 55.13 | ▼ Abwärtstrend |
| 2026-05-14 | 55.76 | ▼ Abwärtstrend |
| 2026-05-13 | 54.90 | ▼ Abwärtstrend |
| 2026-05-12 | 56.51 | ▲ Aufwärtstrend |
| 2026-05-11 | 58.04 | ▲ Aufwärtstrend |
| 2026-05-08 | 60.80 | ▲ Aufwärtstrend |
| 2026-05-07 | 61.85 | ▲ Aufwärtstrend |
Analyzing the calculated EMAs, the current trend shows a persistent downtrend as the EMA20 cuts below EMA50, indicating bearish momentum. Investors should prepare for potential continued pressure unless a reversal is indicated.
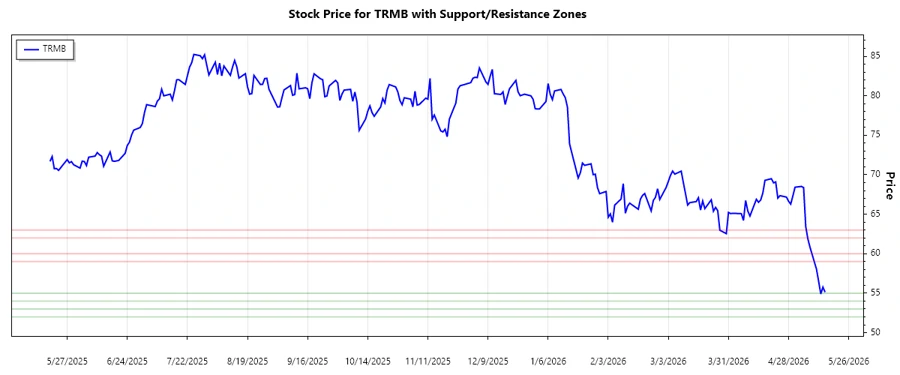
Support and Resistance
| Zone Type | From | To |
|---|---|---|
| Support 1 | 54.00 | 55.00 |
| Support 2 | 52.00 | 53.00 |
| Resistance 1 | 59.00 | 60.00 |
| Resistance 2 | 62.00 | 63.00 |
The current price hovers around a critical support zone; a break below could signify further declines, while sustaining above provides hope for recovery. Investors should keep a keen eye on price action within these zones.
Conclusion
The recent analysis of Trimble Inc.'s stock suggests a dominant bearish trend, as evidenced by EMA analysis and support levels. The company remains robust in technological advancements, yet market volatility presents both opportunities and risks. Applying caution with strategic entry points can mitigate potential losses. Continued monitoring of support and resistance zones is crucial for anticipating market movements, allowing informed decision-making to exploit potential gains or avoid further declines.
**JSON-Objekt:**
Smart Data Insight
Master the Perfect Entry & Exit for this Stock
Don't leave your profits to chance. Historically, this stock follows specific seasonal patterns that institutional traders use to maximize returns.
- ✅ Identify the "Golden Buying Window"
- ✅ Avoid high-risk correction cycles
- ✅ Backtested data from the last 20+ years