August 29, 2025 a 03:15 am
TRMB: Trend and Support & Resistance Analysis - Trimble Inc.
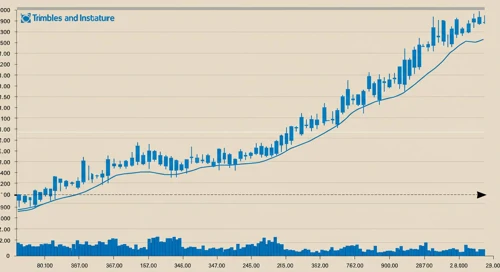
Trimble Inc., with its extensive range of technological solutions, shows promising performance in its stock trend, reflecting potential growth driven by innovative solutions in various segments like Buildings, Infrastructure, and Geospatial markets. The recent price movements indicate a bullish trend, highlighting investor confidence. However, investors should stay cautious about market volatility that could affect the stock price in the short term.
Trend Analysis
| Date | Close Price | Trend |
|---|---|---|
| 28-Aug-2025 | $82.21 | ▲ Uptrend |
| 27-Aug-2025 | $82.18 | ▲ Uptrend |
| 26-Aug-2025 | $81.44 | ▲ Uptrend |
| 25-Aug-2025 | $81.43 | ▲ Uptrend |
| 22-Aug-2025 | $82.58 | ▲ Uptrend |
| 21-Aug-2025 | $80.27 | ▼ Downtrend |
| 20-Aug-2025 | $80.20 | ▼ Downtrend |
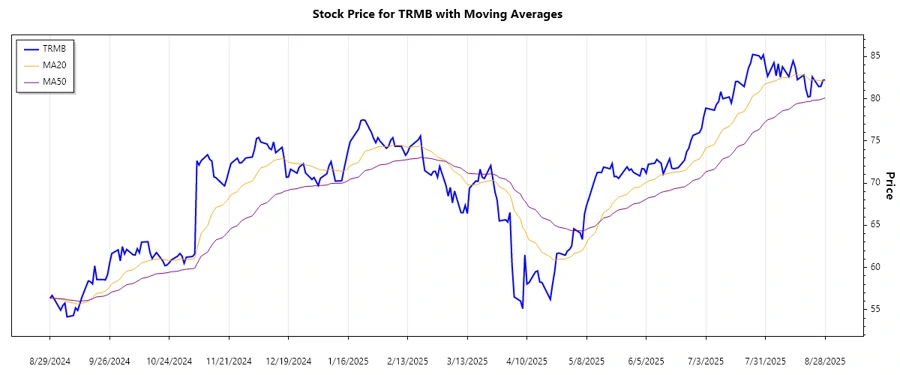
The recent analysis of the Trimble Inc. stock indicates a dominant uptrend as observed from the EMA20 > EMA50 crossover. This reflects a positive sentiment among investors, though market watchers should be aware of a minor correction reflected in the last two entries.
Support and Resistance
| Zone Type | From | To |
|---|---|---|
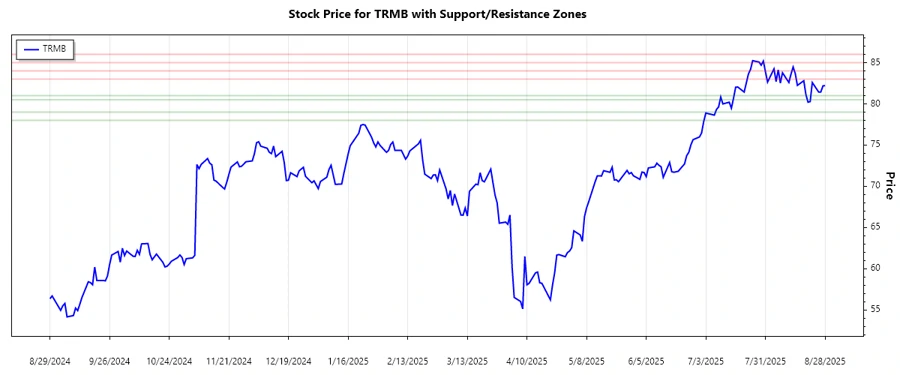
| Support Zone 1 | $80.50 | $81.00 |
| Support Zone 2 | $78.00 | $79.00 |
| Resistance Zone 1 | $83.00 | $84.00 |
| Resistance Zone 2 | $85.00 | $86.00 |
Currently, the stock price is approaching the first resistance zone, indicating a test of bullish strength. It is advised to watch closely for a breakout or reversal pattern.
Conclusion
Trimble Inc. presents an interesting case with its strong upward trajectory in recent weeks. Its diversified technological portfolio provides a hedge against sector-specific downturns, however, exposure to global economic swings could introduce volatility. The stock currently lies in close proximity to a resistance line, offering analysts the opportunity to foresee potential breakout scenarios. Investors should weigh these factors, aligning them with their risk tolerance and investment goals.
Smart Data Insight
Master the Perfect Entry & Exit for this Stock
Don't leave your profits to chance. Historically, this stock follows specific seasonal patterns that institutional traders use to maximize returns.
- ✅ Identify the "Golden Buying Window"
- ✅ Avoid high-risk correction cycles
- ✅ Backtested data from the last 20+ years