
July 14, 2026 a 08:15 am
TRGP: Trend and Support & Resistance Analysis - Targa Resources Corp.
Targa Resources Corp., a key player in the North American midstream energy sector, has shown recent price fluctuations, offering potential trading opportunities. The stock's strategic positioning in gathering, processing, logistics, and transportation influences its market movements. Technical analysis can help identify potential trends and pivotal support and resistance levels.
Trend Analysis
| Date | Close Price | Trend |
|---|---|---|
| 2026-07-13 | 279.40 | ▲ |
| 2026-07-10 | 273.35 | ▲ |
| 2026-07-09 | 273.02 | ▲ |
| 2026-07-08 | 277.86 | ▲ |
| 2026-07-07 | 273.81 | ▲ |
| 2026-07-06 | 263.52 | ▲ |
| 2026-07-02 | 258.88 | ▲ |
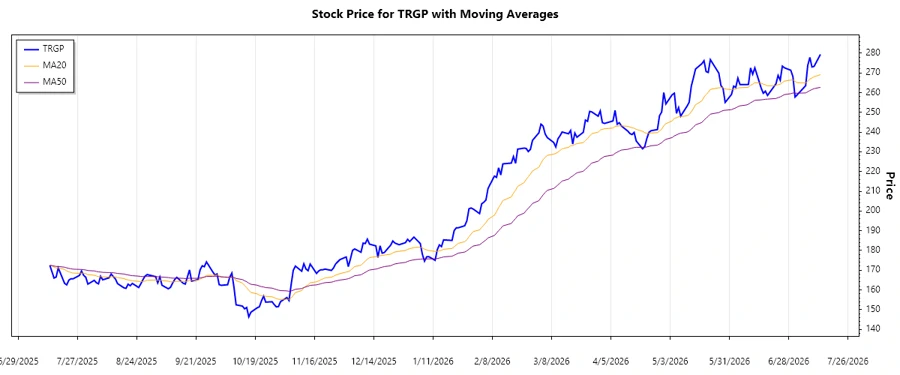
The analysis indicates a strong upward trend given the EMA calculations, suggesting an optimistic outlook for short-term gains.
Support- and Resistance
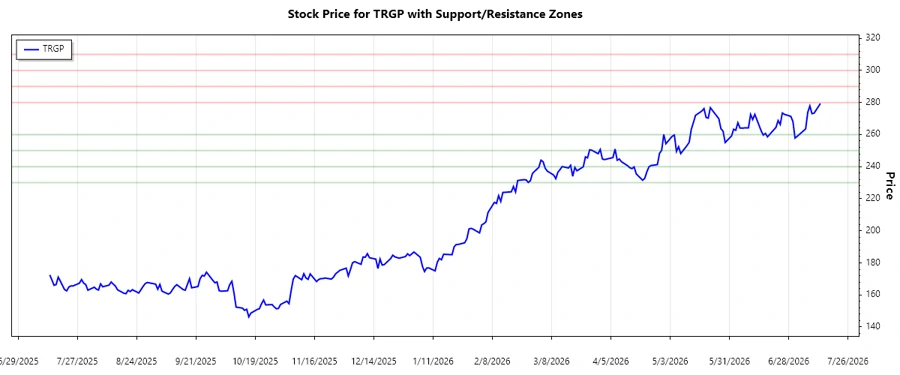
Key support and resistance levels have been observed, where price stability or reversal may occur.
| Zone Type | Zone From | Zone To |
|---|---|---|
| Support ▼ | 250.00 | 260.00 |
| Support ▼ | 230.00 | 240.00 |
| Resistance ▲ | 280.00 | 290.00 |
| Resistance ▲ | 300.00 | 310.00 |
Currently, the stock appears to be testing the upper resistance zone, reflecting heightened buyer interest. The stock could either break out or revert to support levels.
Conclusion
The outlook for Targa Resources Corp. (TRGP) is promising, with technical indicators suggesting a potential rise within its defined resistance zone. However, market dynamics could shift, and investors should remain cautious. Maintaining awareness of global energy trends and sector developments is critical for informed decision-making. While an upward trend offers lucrative prospects, potential resistance breakouts should be monitored closely as they can dictate future price movements. TRGP's diverse operational footprint provides resilience against market volatility, yet unforeseen logistical or regulatory hurdles remain potential risks.
Interpretation: Based on the provided data, Targa Resources Corp. has exhibited a notable upward trend in recent months. The EMA calculations backed this observation, while the current price positioning near the resistance zone suggests a potential for further price action, necessitating consistent monitoring.
Smart Data Insight
Master the Perfect Entry & Exit for this Stock
Don't leave your profits to chance. Historically, this stock follows specific seasonal patterns that institutional traders use to maximize returns.
- ✅ Identify the "Golden Buying Window"
- ✅ Avoid high-risk correction cycles
- ✅ Backtested data from the last 20+ years