
June 29, 2026 a 01:15 pm
TRGP: Trend and Support & Resistance Analysis - Targa Resources Corp.
Targa Resources Corp., engaged in the midstream energy sector, demonstrates volatility in its stock performance influenced by energy market dynamics. With recent price movements indicating a rise, the company may benefit from potential upticks in energy demands. However, investors must remain aware of broader market impacts on the energy sector.
Trend Analysis
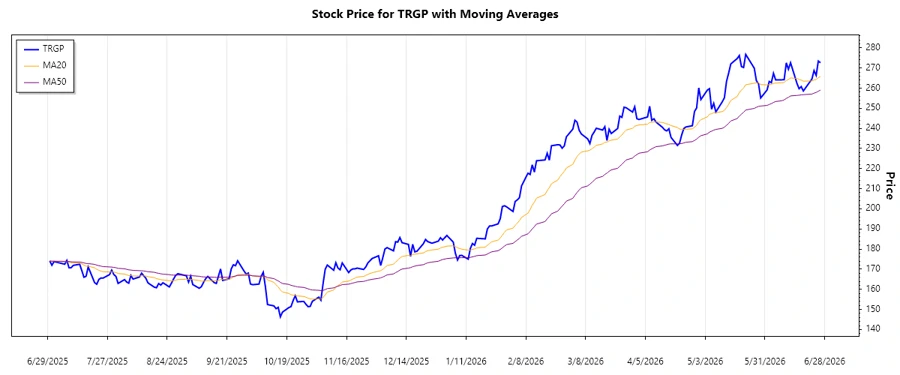
The recent trend analysis for Targa Resources Corp. shows an overall upward trajectory in stock prices. Calculating the exponential moving averages (EMA) of 20 and 50 days provides insight into current trends. Here is a detailed overview with data-derived interpretations:
| Date | Close Price | Trend |
|---|---|---|
| 2026-06-26 | $272.61 | ▲ Upward |
| 2026-06-25 | $273.45 | ▲ Upward |
| 2026-06-24 | $266.32 | ▼ Downward |
| 2026-06-23 | $268.72 | ▲ Upward |
| 2026-06-22 | $264.51 | ▼ Downward |
| 2026-06-18 | $258.58 | ▼ Downward |
| 2026-06-17 | $260.74 | ▲ Upward |
Upon examining the EMAs, the EMA20 currently exceeds the EMA50, suggesting a predominant upward trend. Investors might view this as an opportunity, yet cautious evaluation of broader trends is advised.
Support and Resistance
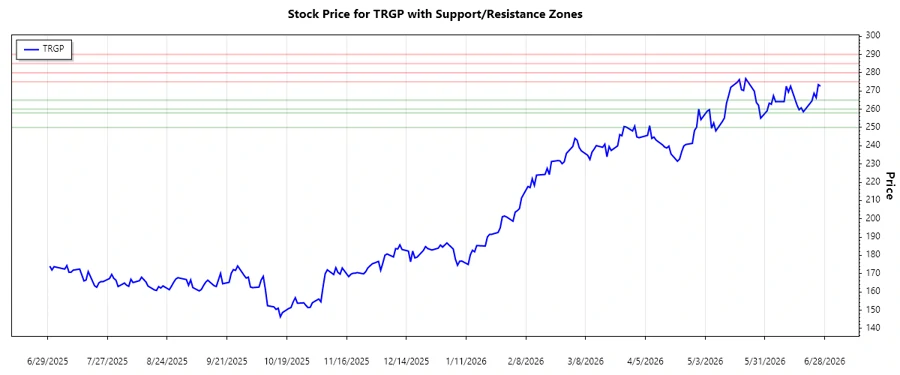
The following analysis identifies significant support and resistance zones based on the recent price data:
| Zone Type | From | To |
|---|---|---|
| Support Zone 1 | $260 | $265 |
| Support Zone 2 | $250 | $258 |
| Resistance Zone 1 | $275 | $280 |
| Resistance Zone 2 | $285 | $290 |
Currently, the price hovers near the resistance zone of $275 to $280, which might require further momentum to breach. Review of these technical levels provides necessary guidance for potential entry or exit points.
Conclusion
The stock of Targa Resources Corp. is demonstrating positive momentum, supported by its operations in the midstream energy sector. With vital support zones outlined, there is significant room for future growth if price breaches current resistance levels. Yet, industry-related risks persist, requiring rigorous market monitoring. As such, this upward trend presents opportunities but necessitates balanced risk consideration.
Smart Data Insight
Master the Perfect Entry & Exit for this Stock
Don't leave your profits to chance. Historically, this stock follows specific seasonal patterns that institutional traders use to maximize returns.
- ✅ Identify the "Golden Buying Window"
- ✅ Avoid high-risk correction cycles
- ✅ Backtested data from the last 20+ years