February 17, 2026 a 03:15 am

TRGP: Trend and Support & Resistance Analysis - Targa Resources Corp.
Targa Resources Corp. shows a recent bullish trend in its stock price performance. This energy infrastructure company, with its extensive pipelines and processing plants, has benefited from recent upward momentum in energy prices. The stock has broken past several resistance zones, indicating strong bullish sentiment.
Trend Analysis
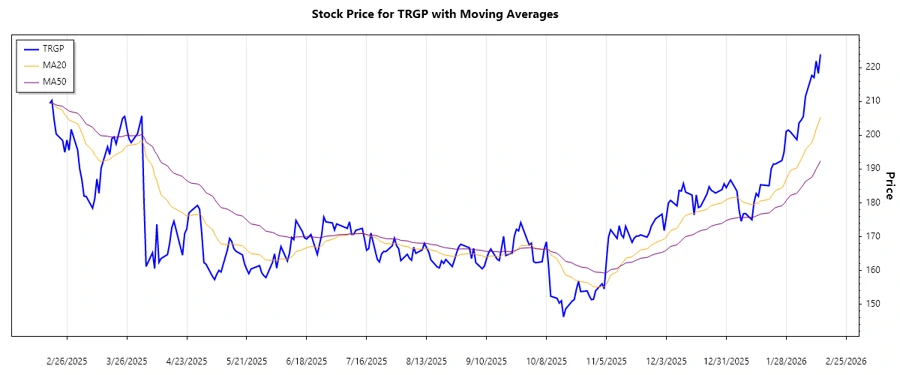
The recent performance of TRGP indicates a strong upward trend as the EMA20 has surpassed the EMA50. This typically signals bullish sentiment in the market, likely driven by increased demand or favorable market conditions.
| Date | Close Price | Trend |
|---|---|---|
| 2026-02-13 | 223.89 | ▲ Uptrend |
| 2026-02-12 | 218.26 | ▲ Uptrend |
| 2026-02-11 | 221.91 | ▲ Uptrend |
| 2026-02-10 | 217.06 | ▲ Uptrend |
| 2026-02-09 | 217.7 | ▲ Uptrend |
| 2026-02-06 | 211.44 | ▲ Uptrend |
| 2026-02-05 | 205.55 | ▲ Uptrend |
Technically, with both EMAs indicating a continued rise, the TRGP stock shows potential for further gains.
Support and Resistance
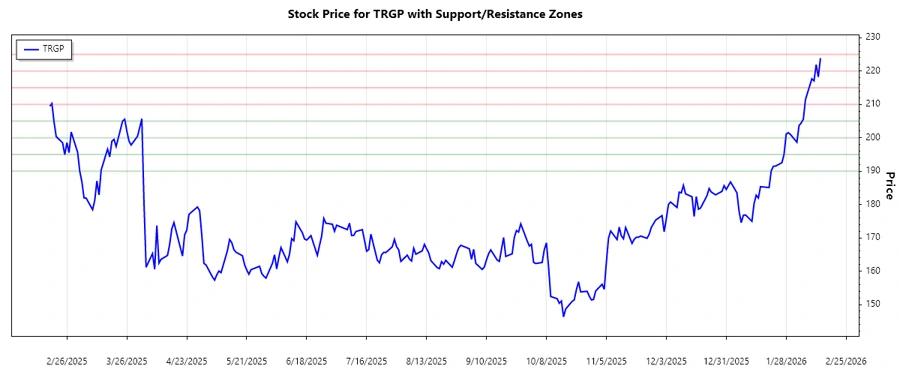
The historical price action has identified key support and resistance zones. Understanding these areas can provide insights into potential price movements.
| Zone Type | Level From | Level To |
|---|---|---|
| Resistance Zone 1 | 210.00 | 215.00 |
| Resistance Zone 2 | 220.00 | 225.00 |
| Support Zone 1 | 200.00 | 205.00 |
| Support Zone 2 | 190.00 | 195.00 |
Currently, the stock is advancing above the resistance zones, indicating strong market sentiment. This breach suggests the price might hold above these levels, poised for further upward movement.
Conclusion
TRGP's current uptrend is strongly supported by recent technical signals. The breach of resistance zones points to robust market confidence, and with consistent support levels holding, analysts have a bullish outlook on the stock. However, any market-wide disruptions or significant dips in the energy market could pressure these levels, requiring a reevaluation of positions.