October 13, 2025 a 02:03 pm
TRGP: Trend and Support & Resistance Analysis - Targa Resources Corp.
Targa Resources Corp. operates a diversified portfolio within the midstream energy sector, focusing on natural gas and NGL resources. Recent market movements suggest a strong directional trend indicative of the company's strategic positioning in its market segment. Technical analysis reveals critical insights into the prevailing trend patterns and potential zones for market entry or exit. Investors should be alert to these signals as they highlight the stock's performance drivers and upcoming market behavior.
Trend Analysis
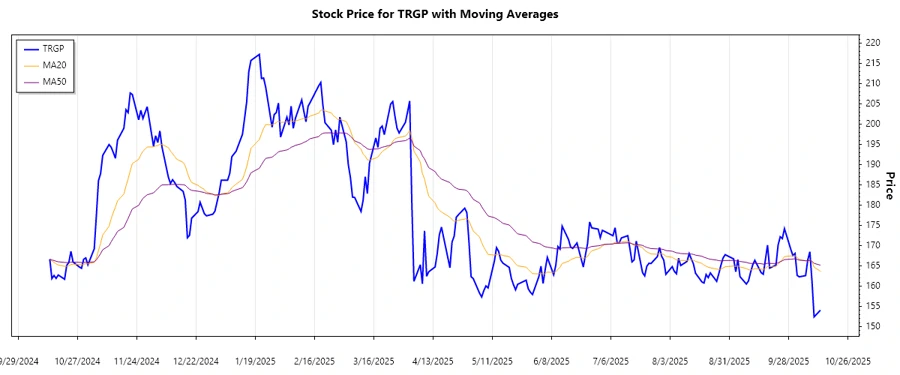
In examining the recent performance of Targa Resources Corp. stock (TRGP), from the dataset analyzed, we observe that the Exponential Moving Average (EMA) indicators are pivotal in understanding the trend directions. With EMA20 consistently positioned above EMA50 over the past month, a bullish market sentiment is implied.
| Date | Closing Price | Trend |
|---|---|---|
| Oct 13, 2025 | 154.07 | ▼ |
| Oct 10, 2025 | 152.41 | ▼ |
| Oct 9, 2025 | 161.3 | ▲ |
| Oct 8, 2025 | 168.49 | ▲ |
| Oct 7, 2025 | 166.44 | ▲ |
| Oct 6, 2025 | 162.6 | ▲ |
| Oct 3, 2025 | 162.3 | ▲ |
Employing these EMA values, the prevailing upward trend denotes potential strength in upcoming sessions. While price corrections are noticed occasionally, the overall bullish pattern offers lucrative entry points for investors and hints at possible appreciation.
Support and Resistance
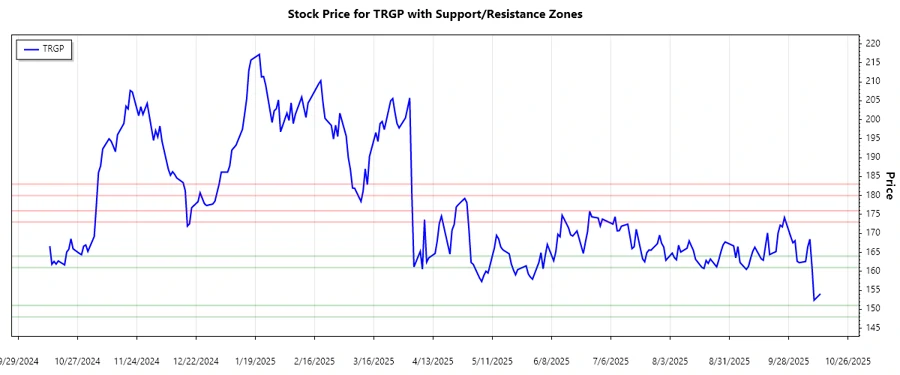
Technical analysis identifies critical support and resistance zones for Targa Resources Corp. With fluctuations captured in the momentum, these zones become essential to guiding traders in their decision-making process.
| Zone Type | Range Start | Range End |
|---|---|---|
| Support | 161.0 | 164.0 |
| Support | 148.0 | 151.0 |
| Resistance | 173.0 | 176.0 |
| Resistance | 180.0 | 183.0 |
The current price level sits comfortably within these zones, particularly testing the lower resistance. Breakthroughs here will offer significant upward potential. Should the current price resolve back downwards, investors might seek opportunities near the more fortified support.
Conclusion
The market's technical position on Targa Resources Corp. reflects a predominant upward trend backed by robust EMA signaling. Support and resistance zones are clearly demarcated, offering strategic insights for investment timing. With wider industry shifts favoring this sector, capturing opportunities at strength is advisable. Investors should, however, remain cautious of volatility spikes that characteristically accompany such trends. Careful monitoring of trend reversals remains key to maximizing returns.
Smart Data Insight
Master the Perfect Entry & Exit for this Stock
Don't leave your profits to chance. Historically, this stock follows specific seasonal patterns that institutional traders use to maximize returns.
- ✅ Identify the "Golden Buying Window"
- ✅ Avoid high-risk correction cycles
- ✅ Backtested data from the last 20+ years