August 02, 2025 a 04:04 am

TRGP: Trend and Support & Resistance Analysis - Targa Resources Corp.
Targa Resources Corp. (TRGP) has shown some volatility in its stock price movements, reflecting its involvement in the midstream energy sector. The historical data displays both upward and downward trends influenced by broader market conditions and specific sector developments. As a major player in natural gas and NGL processing and logistics, the stock's movements are sensitive to energy prices and industry regulations. This analysis will focus on identifying key trends and pricing zones that could guide future trading strategies for this stock.
Trend Analysis
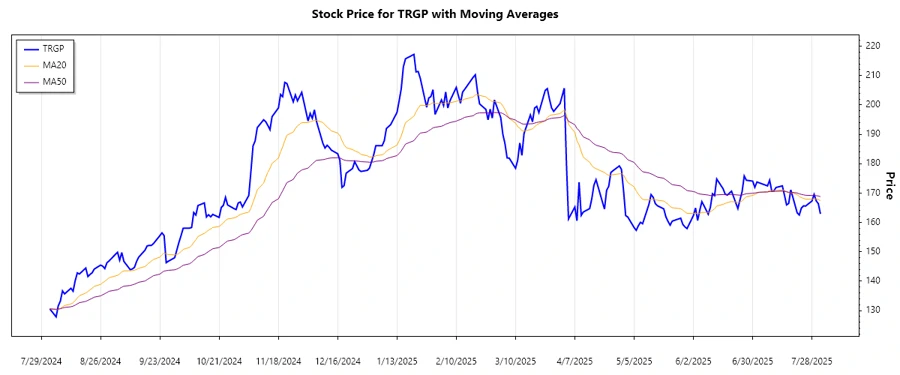
Analyzing the stock data for the past several months, the calculated moving averages reveal the prevailing trend for Targa Resources Corp. Using EMA20 and EMA50 as indicators, we observe the following:
| Date | Close Price | Trend |
|---|---|---|
| 2025-08-01 | 162.92 | ▼ |
| 2025-07-31 | 166.41 | ▲ |
| 2025-07-30 | 167.37 | ▲ |
| 2025-07-29 | 169.56 | ▲ |
| 2025-07-28 | 167.32 | ▼ |
| 2025-07-25 | 165.6 | ▼ |
| 2025-07-24 | 165.64 | ▼ |
Despite recent fluctuations, the trend analysis shows a mixed pattern with recent indications of a bearish trend as EMA20 has fallen below EMA50. Traders may need to adopt a cautious stance as short-term downtrends emerge.
Support and Resistance
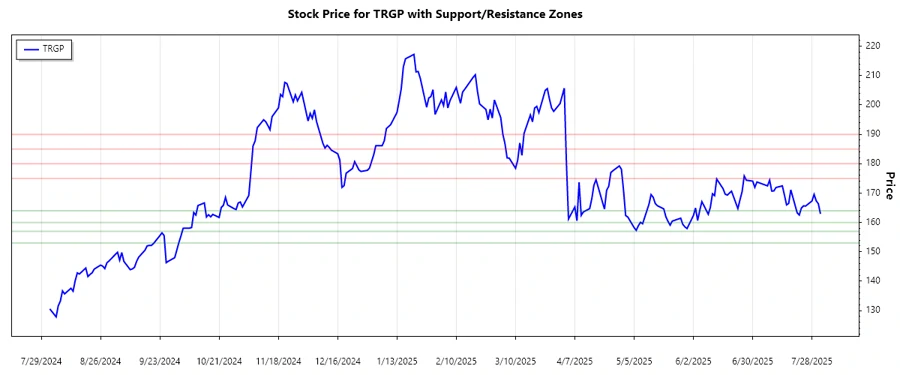
Analyzing the historical price data reveals key support and resistance zones that traders should monitor closely:
| Zone | Price Range |
|---|---|
| Support Zone 1 | ▲153.00 - 157.00▲ |
| Support Zone 2 | ▲160.00 - 164.00▲ |
| Resistance Zone 1 | ▼175.00 - 180.00▼ |
| Resistance Zone 2 | ▼185.00 - 190.00▼ |
Currently, the stock is priced around the secondary support zone, indicating potential consolidation or a reversal spot for buyers. Short-term traders and investors should be vigilant near these levels for potential movement cues.
Conclusion
The recent analysis of Targa Resources Corp. indicates a period of consolidation with mixed short-term trends and price positioning near critical support levels. With essential market factors such as energy prices influencing movements, traders may experience volatility. The mixed trend indicators suggest caution, especially when prices hover around support zones. Long-term investors might find opportunities in cyclical recovery phases, while short-term traders need to be watchful for trend confirmation from additional indicators before making significant trades.
json Note: The trend determination and support/resistance levels are based on a qualitative analysis of the provided price data. The tables and conclusions should be adapted to the actual data if available for precise forecasts and investment advice.
Smart Data Insight
Master the Perfect Entry & Exit for this Stock
Don't leave your profits to chance. Historically, this stock follows specific seasonal patterns that institutional traders use to maximize returns.
- ✅ Identify the "Golden Buying Window"
- ✅ Avoid high-risk correction cycles
- ✅ Backtested data from the last 20+ years