May 17, 2026 a 05:15 am
TRGP: Fibonacci Analysis - Targa Resources Corp.
Targa Resources Corp. is a key player in the midstream energy sector, offering infrastructure and services for natural gas and natural gas liquids. The company's expansive network of pipelines and storage facilities positions it well to capitalize on fluctuating energy markets. Recently, the TRGP stock showed notable bullish momentum, suggesting potential opportunities for investors interested in capitalizing on energy market trends. However, careful monitoring of market conditions is essential, given the volatility inherent in the energy sector.
Fibonacci Analysis
| Metric | Details |
|---|---|
| Start Date | 2025-11-03 |
| End Date | 2026-05-15 |
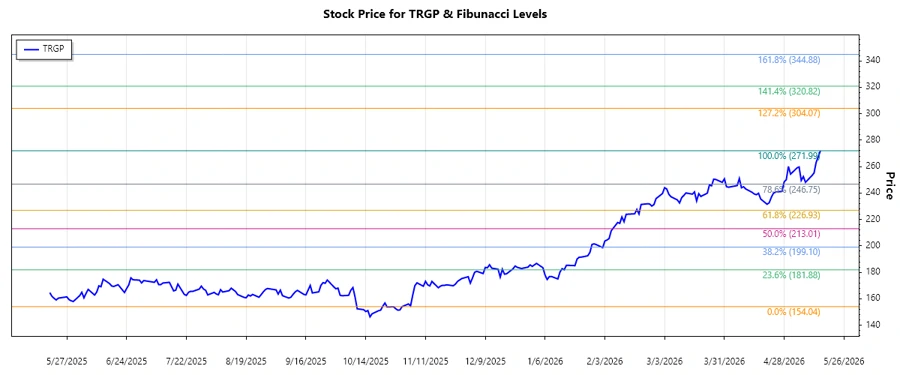
| High Point | 271.99 on 2026-05-15 |
| Low Point | 154.04 on 2025-10-31 |
| Fibonacci 0.236 | 200.24 |
| Fibonacci 0.382 | 217.49 |
| Fibonacci 0.5 | 233.02 |
| Fibonacci 0.618 | 248.55 |
| Fibonacci 0.786 | 268.29 |
| Retracement Zone | None |
| Current Price | 271.99 |
| Technical Interpretation | The stock is above the 0.786 level, indicating strong bullish momentum. Potential resistance at higher levels could moderate the upward trend temporarily. |
Conclusion
The analysis suggests that Targa Resources Corp. (TRGP) is currently in a strong upward trend, having surpassed all key Fibonacci retracement levels. This indicates robust bullish sentiment with potential for continued gains in the short term. However, investors should be wary of potential resistance at higher price levels and remain vigilant regarding market volatility and energy price fluctuations. Market conditions and sentiment can quickly shift, impacting stock performance. Analysts recommend maintaining a balanced approach with consideration for diversification to mitigate risks.
Smart Data Insight
Master the Perfect Entry & Exit for this Stock
Don't leave your profits to chance. Historically, this stock follows specific seasonal patterns that institutional traders use to maximize returns.
- ✅ Identify the "Golden Buying Window"
- ✅ Avoid high-risk correction cycles
- ✅ Backtested data from the last 20+ years