May 07, 2026 a 04:44 pm
TRGP: Fibonacci Analysis - Targa Resources Corp.
Targa Resources Corp. has shown a dominant uptrend over the past months. Given its strategic position in the midstream energy sector, the company has benefited from steady operational performance and favorable market conditions. With a strong infrastructure backbone and a diversified asset portfolio, TRGP could see sustained growth. However, the volatile nature of energy prices suggests investors should remain vigilant.
Fibonacci Analysis
| Start Date | End Date | High Price | High Date | Low Price | Low Date |
|---|---|---|---|---|---|
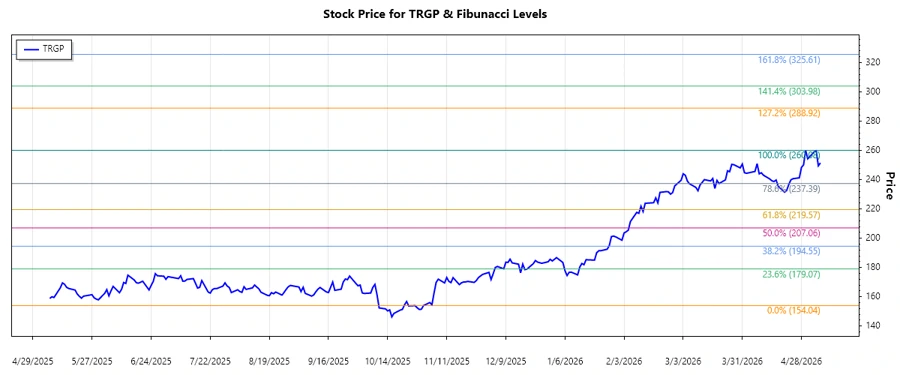
| 2025-11-03 | 2026-04-30 | 260.08 | 2026-04-30 | 154.04 | 2025-10-31 |
| Retracement Level | Price Level |
|---|---|
| 0.236 | 230.68 |
| 0.382 | 215.28 |
| 0.5 | 207.06 |
| 0.618 | 198.84 |
| 0.786 | 186.14 |
As of the latest data, the current price is $251.47, which is above the highest retracement level. Therefore, it is not in any retracement zone, indicating potential support at the 0.236 level.
This suggests that should any corrections occur, the first major support is likely at the 0.236 level, serving as a potential pullback area for technical analysts.
Conclusion
Targa Resources Corp. has shown robust upward momentum recently, showing strength in its operational strategy and market presence. Despite the prospect of energy market volatility, TRGP's strong asset base and midstream operations may provide a buffer against rapid downturns. The observed Fibonacci retracement levels suggest a strong support base at the 0.236 level, which may hold during short-term sell-offs. Analysts should be cautious of external macroeconomic factors influencing energy prices. Overall, Targa Resources Corp. presents a balanced opportunity, combining potential growth with inherent market risks.
Smart Data Insight
Master the Perfect Entry & Exit for this Stock
Don't leave your profits to chance. Historically, this stock follows specific seasonal patterns that institutional traders use to maximize returns.
- ✅ Identify the "Golden Buying Window"
- ✅ Avoid high-risk correction cycles
- ✅ Backtested data from the last 20+ years