August 27, 2025 a 04:44 pm

TRGP: Fibonacci Analysis - Targa Resources Corp.
Targa Resources Corp. has shown a strong performance in the energy sector, with its operations primarily focused on midstream assets in North America. Despite market volatilities, the company has managed stable returns due to its diversified portfolio. Recent data suggests potential for growth, yet investors should remain cautious given the fluctuations in the sector.
Fibonacci Analysis
| Item | Details |
|---|---|
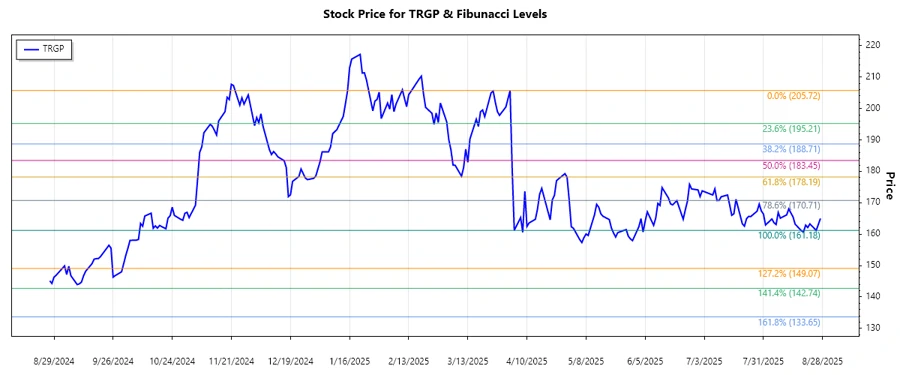
| Trend Start Date | 2025-04-02 |
| Trend End Date | 2025-08-27 |
| High Price & Date | $205.72 on 2025-04-02 |
| Low Price & Date | $161.18 on 2025-08-25 |
| Fibonacci Level | Price Level |
|---|---|
| 23.6% | $170.68 |
| 38.2% | $178.18 |
| 50% | $183.45 |
| 61.8% | $188.72 |
| 78.6% | $196.22 |
Current price is $164.985, which places it near the 23.6% retracement level, suggesting a possible support area as buyers might step in.
This level can be a strong support level, from where prices may potentially recover.
Conclusion
The analysis suggests that Targa Resources Corp. is currently experiencing a downturn, but could find support at the 23.6% Fibonacci retracement level. This might present a buying opportunity for risk-tolerant investors. However, overall market volatility and potential fluctuations in energy prices are risks that should be considered. The stock’s midstream energy operations offer a stable business model, yet investors should monitor price changes closely for potential breakout movements or further declines.
Smart Data Insight
Master the Perfect Entry & Exit for this Stock
Don't leave your profits to chance. Historically, this stock follows specific seasonal patterns that institutional traders use to maximize returns.
- ✅ Identify the "Golden Buying Window"
- ✅ Avoid high-risk correction cycles
- ✅ Backtested data from the last 20+ years