
June 20, 2026 a 03:30 pm
TRGP: Dividend Analysis - Targa Resources Corp.
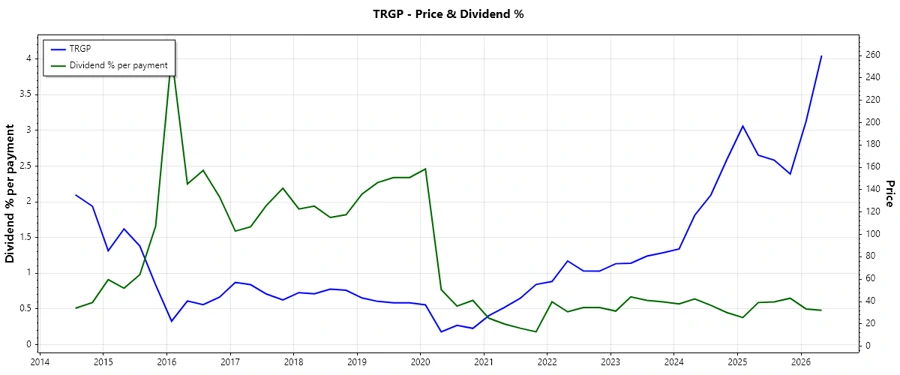
Located in the energy sector, Targa Resources Corp. presents a modest dividend yield of 1.63%. Although this yield may not appear substantial, the company's commitment to steady dividend payments over 16 years positions it as a reliable income option for conservative investors. However, potential investors should be mindful of the high payout ratios and the company's leverage, which may pose risks.
Overview 📊
The overview provides key insight into Targa Resources Corp.'s dividend profile, showcasing its stability and commitment to returning value to shareholders.
| Metric | Value |
|---|---|
| Sector | Energy |
| Dividend yield | 1.63% |
| Current dividend per share | 3.81 USD |
| Dividend history | 16 years |
| Last cut or suspension | None |
Dividend History 🗣️
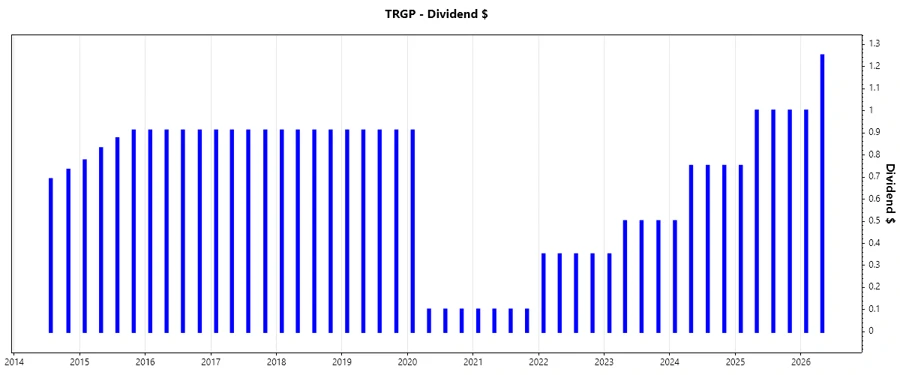
The historical payout trend is critical in gauging a company's reliability in returning capital to shareholders. For Targa Resources Corp., a consistent payment history is evident, although with fluctuations in the dividend amount.
| Year | Dividend per Share (USD) |
|---|---|
| 2026 | 2.25 |
| 2025 | 3.75 |
| 2024 | 2.75 |
| 2023 | 1.85 |
| 2022 | 1.40 |
Dividend Growth 📈
Understanding growth trends helps predict future dividend capacity. A compounded annual growth rate over 3 and 5 years shows the company's potential growth in return on dividends.
| Time | Growth |
|---|---|
| 3 years | 0.39% |
| 5 years | 0.25% |
The average dividend growth is 0.25% over 5 years. This shows moderate but steady dividend growth.
Payout Ratio 📉
The payout ratios provide insights into the sustainability of the dividend policy, evaluating how effectively a company distributes earnings as dividends.
| Key figure | Ratio |
|---|---|
| EPS-based | 38.50% |
| Free cash flow-based | 311.93% |
The EPS payout ratio of 38.50% suggests a disciplined approach to dividends. However, the high free cash flow payout ratio of 311.93% indicates potential issues with cash flow sustainability.
Cashflow & Capital Efficiency ✅
Cash flow metrics are essential to assess liquidity and operational efficiency, indicating the ability to fund operations, pay debts, and remunerate shareholders.
| Metric | 2025 | 2024 | 2023 |
|---|---|---|---|
| Free Cash Flow Yield | 1.47% | 1.74% | 4.23% |
| Earnings Yield | 4.65% | 3.23% | 4.24% |
| CAPEX to Operating Cash Flow | 85.09% | 81.26% | 74.27% |
| Stock-based Compensation to Revenue | 0% | 0.38% | 0.40% |
| Free Cash Flow / Operating Cash Flow Ratio | 14.91% | 18.74% | 25.73% |
The analysis shows relatively strong operational efficiency but potential challenges in covering dividends and other expenditures entirely from cash flows.
Balance Sheet & Leverage Analysis ⚠️
Analyzing leverage ratios is important for understanding financial stability and the extent of debt use for operations.
| Metric | 2025 | 2024 | 2023 |
|---|---|---|---|
| Debt-to-Equity | 571.93% | 550.26% | 474.88% |
| Debt-to-Assets | 69.58% | 62.75% | 62.94% |
| Debt-to-Capital | 85.12% | 84.62% | 82.61% |
| Net Debt to EBITDA | 3.58 | 3.41 | 3.24 |
| Current Ratio | 0.67 | 0.72 | 0.79 |
| Quick Ratio | 0.55 | 0.62 | 0.66 |
| Financial Leverage | 822.01% | 876.95% | 754.53% |
The elevated leverage ratios signal significant reliance on debt, posing risks if market conditions shift adversely.
Fundamental Strength & Profitability 🧮
Profitability metrics shed light on operational efficiency and competitiveness in the market space.
| Metric | 2025 | 2024 | 2023 |
|---|---|---|---|
| Return on Equity | 60.12% | 48.97% | 30.23% |
| Return on Assets | 7.31% | 5.58% | 4.01% |
| Net Profit Margin | 10.76% | 7.64% | 5.30% |
| EBIT Margin | 19.49% | 16.27% | 16.84% |
| EBITDA Margin | 28.33% | 24.89% | 25.39% |
| Gross Margin | 26.51% | 20.00% | 16.23% |
| R&D to Revenue | 0% | 0% | 0% |
Consistent profitability signals competitive strength, yet the absence of R&D spending may limit future growth.
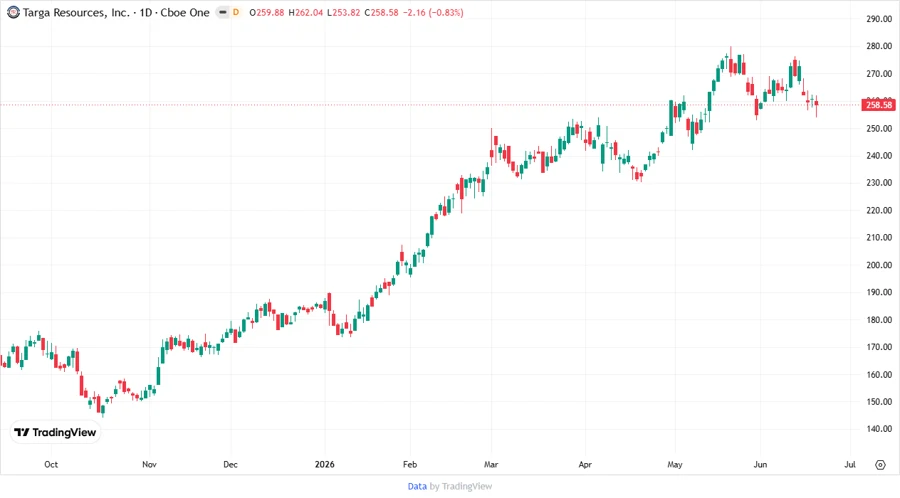
Price Development 💹
Dividend Scoring System ✨
| Criteria | Score (1-5) | Score Bar |
|---|---|---|
| Dividend yield | 2 | |
| Dividend Stability | 4 | |
| Dividend growth | 3 | |
| Payout ratio | 2 | |
| Financial stability | 2 | |
| Dividend continuity | 4 | |
| Cashflow Coverage | 2 | |
| Balance Sheet Quality | 2 |
Total Score: 21/40
Rating ⭐
Targa Resources Corp. offers a mixed dividend profile, characterized by its solid historical performance and modest yield. While there is potential for income, prospective investors should weigh the financial stability and sustainability risks, particularly related to debt and free cash flow coverage. It remains best suited for those seeking consistent, albeit modest, dividend income in the energy sector.
Smart Data Insight
Master the Perfect Entry & Exit for this Stock
Don't leave your profits to chance. Historically, this stock follows specific seasonal patterns that institutional traders use to maximize returns.
- ✅ Identify the "Golden Buying Window"
- ✅ Avoid high-risk correction cycles
- ✅ Backtested data from the last 20+ years