March 14, 2026 a 12:46 pm
TRGP: Dividend Analysis - Targa Resources Corp.
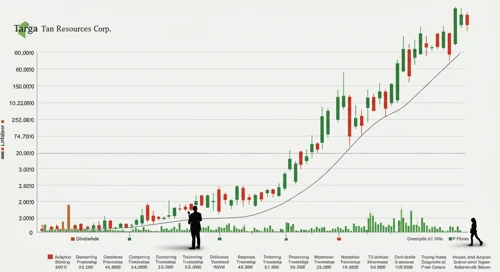
Targa Resources Corp. offers a compelling dividend profile characterized by its modest yield and a steady history of payments. With a consistent track record spanning over 16 years, the company demonstrates a robust commitment to returning capital to shareholders. Although the dividend yield is relatively modest, the firm's growth outlook and financial stability make it a promising investment for dividend-focused portfolios.
📊 Overview
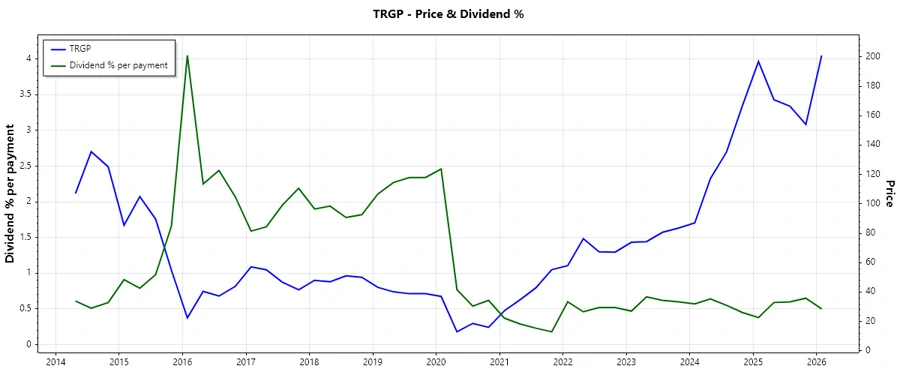
Targa Resources Corp. operates within a dynamic sector, making its dividend yield of 1.99% noteworthy against industry standards. With a current dividend of $3.81 per share and an impressive 16-year dividend history, the last cut or suspension remains undocumented. This resilience underscores a robust policy focused on shareholder returns.
| Metric | Value |
|---|---|
| Sector | Energy |
| Dividend yield | 1.99% |
| Current dividend per share | $3.81 |
| Dividend history | 16 years |
| Last cut or suspension | None |
🗣️ Dividend History
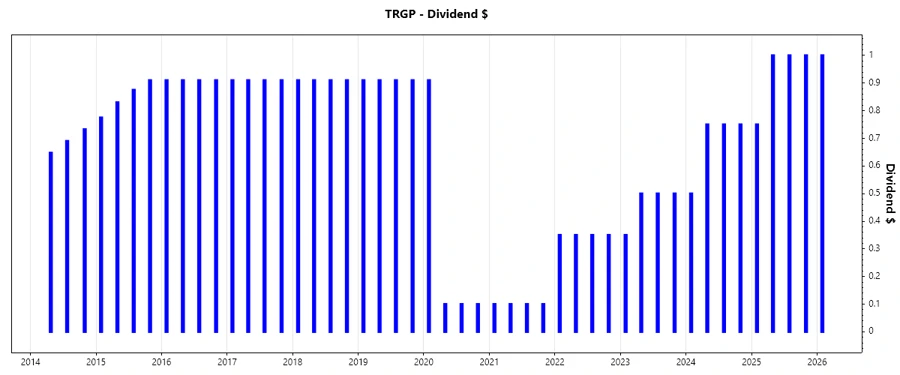
The dividend history of Targa Resources Corp. illustrates its steadfast commitment to returning capital over the years. This commitment can indicate reliability and potentially attract dividend-seeking investors. The company's ability to maintain or grow its dividend through economic cycles may reflect financial strength and an effective management strategy.
| Year | Dividend per Share (USD) |
|---|---|
| 2026 | $1.00 |
| 2025 | $3.75 |
| 2024 | $2.75 |
| 2023 | $1.85 |
| 2022 | $1.40 |
📈 Dividend Growth
Assessing the dividend growth of Targa Resources Corp. over varying time horizons provides a clearer picture of how the firm's dividend policy has evolved. With a 3-year growth rate of 0.39% and a 5-year growth rate of 0.25%, the trajectory suggests modest but steady improvement.
| Time | Growth |
|---|---|
| 3 years | 0.39% |
| 5 years | 0.25% |
The average dividend growth is 0.25% over 5 years. This shows moderate but steady dividend growth.
🔍 Payout Ratio
The payout ratio is a key indicator of dividend sustainability, reflecting the proportion of earnings paid out as dividends. EPS-based at 44.37% and free cash flow-based at 140.06%, Targa Resources Corp. balances its dividends against profits and cash flow, suggesting a well-considered policy to support future payments.
| Key figure | Ratio |
|---|---|
| EPS-based | 44.37% |
| Free cash flow-based | 140.06% |
These figures indicate that the firm adopts a conservative approach with a relatively low EPS payout ratio, while the high free cash flow payout ratio suggests an aggressive current return strategy.
💰 Cashflow & Capital Efficiency
The company's cash flow metrics, such as the Free Cash Flow Yield of 1.13% and the Earnings Yield of 3.57%, provide insight into how efficiently it turns revenues into cash flow and earnings. Maintaining a CAPEX to Operating Cash Flow ratio of 0.85 highlights balanced reinvestment strategies.
| Year | 2025 | 2024 | 2023 |
|---|---|---|---|
| Free Cash Flow Yield | 1.47% | 1.74% | 4.23% |
| Earnings Yield | 4.65% | 3.23% | 4.24% |
| CAPEX to Operating Cash Flow | 85.09% | 81.26% | 74.27% |
| Stock-based Compensation to Revenue | 0.41% | 0.38% | 0.40% |
| Free Cash Flow / Operating Cash Flow Ratio | 14.91% | 18.74% | 25.73% |
These figures suggest Targa Resources Corp. has a stable cash flow with satisfactory reinvestment, though improvements in capital efficiency could further enhance returns.
📊 Balance Sheet & Leverage Analysis
A robust balance sheet underpins financial stability and operational resilience. With a Debt-to-Equity ratio of 5.72 and a Net Debt to EBITDA of 3.58, Targa Resources Corp.'s leverage reflects the sector's capital-intensive nature. Nevertheless, maintained liquidity ratios show prudent financial management.
| Year | 2025 | 2024 | 2023 |
|---|---|---|---|
| Debt-to-Equity | 571.93% | 550.26% | 474.88% |
| Debt-to-Assets | 69.58% | 62.75% | 62.94% |
| Debt-to-Capital | 85.12% | 84.62% | 82.61% |
| Net Debt to EBITDA | 3.58 | 3.41 | 3.24 |
| Current Ratio | 0.67 | 0.72 | 0.79 |
| Quick Ratio | 0.55 | 0.62 | 0.66 |
| Financial Leverage | 8.22 | 8.77 | 7.55 |
Overall, these figures portray a balance of stability and leverage, with Targa Resources Corp. effectively maneuvering within sector norms to uphold fiscal health.
📈 Fundamental Strength & Profitability
Fundamental strengths illustrate a company's intrinsic value and growth potential. Targa Resources Corp. showcases a Return on Equity of 68.22% and Return on Assets of 7.31% in 2025, indicating proficient use of equity financing and asset management.
| Year | 2025 | 2024 | 2023 |
|---|---|---|---|
| Return on Equity | 68.22% | 48.97% | 30.23% |
| Return on Assets | 7.31% | 5.58% | 4.01% |
| Net Margin | 10.76% | 7.64% | 5.30% |
| EBIT Margin | 19.49% | 16.27% | 16.84% |
| EBITDA Margin | 28.33% | 24.89% | 25.39% |
| Gross Margin | 26.51% | 20.00% | 16.23% |
| R&D to Revenue | 0% | 0% | 0% |
These figures highlight the firm's profitability capability, with high returns on equity and assets amplifying its competitive advantage and attractiveness to investors.
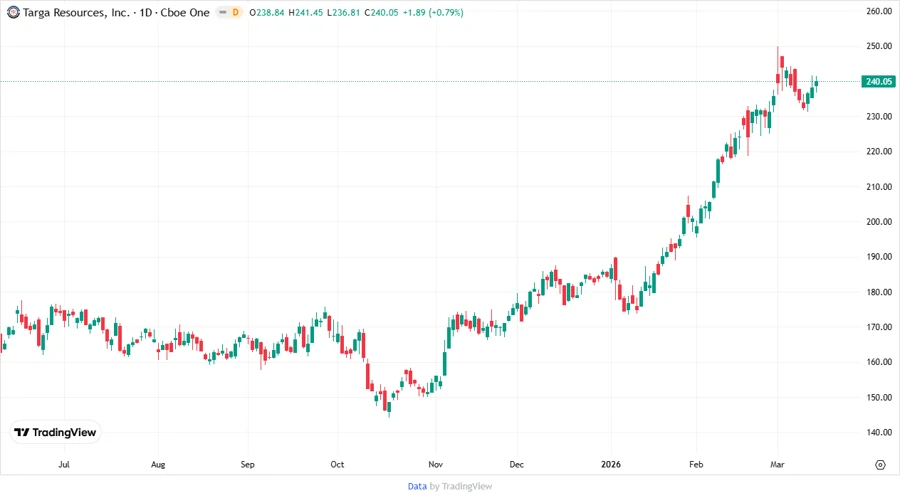
📉 Price Development
✅ Dividend Scoring System
| Criteria | Score | Rating |
|---|---|---|
| Dividend yield | 2 | |
| Dividend stability | 4 | |
| Dividend growth | 3 | |
| Payout ratio | 3 | |
| Financial stability | 3 | |
| Dividend continuity | 4 | |
| Cashflow Coverage | 3 | |
| Balance Sheet Quality | 3 |
Total Score: 25 out of 40
🗣️ Rating
In conclusion, Targa Resources Corp. represents a stable dividend investment opportunity, characterized by its consistent dividend payments and a focused financial strategy. While the company's yield is modest, its growth potential and robust balance sheet suggest a balanced risk-reward proposition for long-term income-focused investors. It offers a reliable option for those seeking steady returns amidst industry volatility.
Smart Data Insight
Master the Perfect Entry & Exit for this Stock
Don't leave your profits to chance. Historically, this stock follows specific seasonal patterns that institutional traders use to maximize returns.
- ✅ Identify the "Golden Buying Window"
- ✅ Avoid high-risk correction cycles
- ✅ Backtested data from the last 20+ years