November 05, 2025 a 07:46 am

TRGP: Dividend Analysis - Targa Resources Corp.
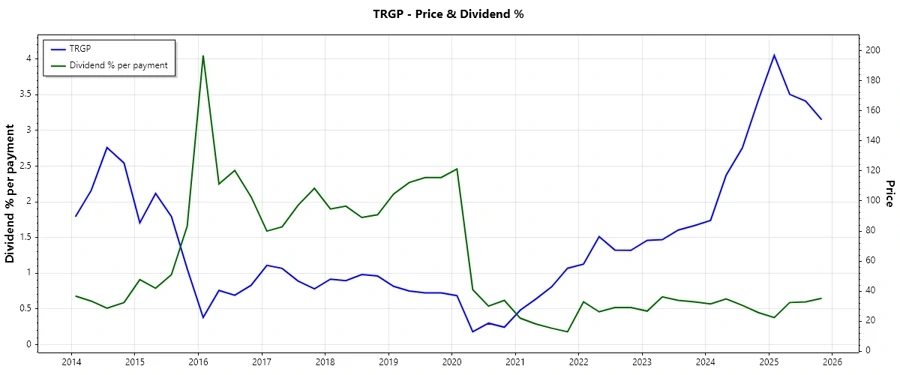
Targa Resources Corp. (TRGP) has demonstrated a solid dividend profile with a history spanning 15 years. The company's dividend yield of 2.43% may not be exceptionally high, but the payout ratio based on EPS suggests a sustainable dividend. Despite a dividend cut in 2021, steady increases in more recent years might attract dividend-focused investors. The sector's outlook will play a significant role in the future dividend growth potential.
📊 Overview
| Key Metrics | Details |
|---|---|
| Sector | Energy |
| Dividend yield | 2.434% |
| Current dividend per share | 2.80 USD |
| Dividend history | 15 years |
| Last cut or suspension | 2021 |
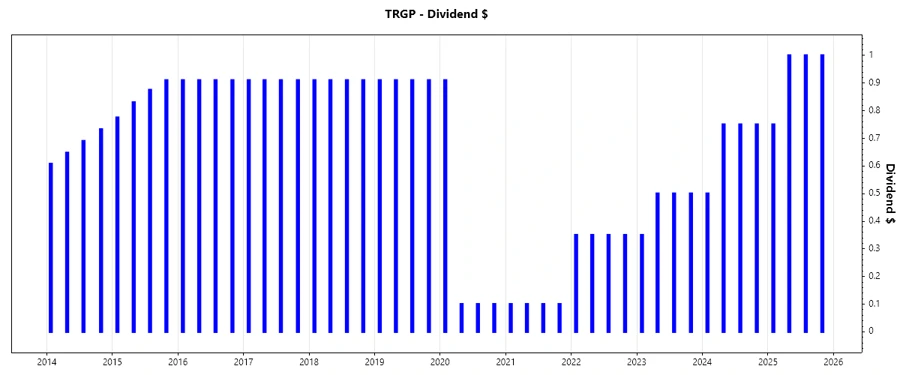
🗣️ Dividend History
The past dividend payments provide insight into the company's commitment to return capital to shareholders. A sustained and growing dividend over the years is a positive indicator of financial health and profitability.
| Year | Dividend Per Share |
|---|---|
| 2025 | 3.75 USD |
| 2024 | 2.75 USD |
| 2023 | 1.85 USD |
| 2022 | 1.40 USD |
| 2021 | 0.40 USD |
📈 Dividend Growth
Dividend growth is critical in preserving purchasing power. Monitoring growth over 3 and 5-year periods can provide insights into future sustainability.
| Time | Growth |
|---|---|
| 3 years | 0.90% |
| 5 years | -0.05% |
The average dividend growth is -0.05% over 5 years. This shows a stable yet stagnant dividend policy recently.
📉 Payout Ratio
The payout ratio indicates how much of the earnings or cash flow is distributed as dividends. A lower ratio suggests room for dividend increase while a higher ratio might imply pressure.
| Key figure | Ratio |
|---|---|
| EPS-based | 39.72% |
| Free cash flow-based | 140.70% |
The EPS-based payout ratio of 39.72% is reasonable, indicating sustainability, whereas the FCF-based ratio at 140.70% suggests the dividends might pressure free cash flow, posing potential risks.
✅ Cashflow & Capital Efficiency
Cash flow efficiency is paramount to understanding the company's operational performance. Metrics like free cash flow yield and CAPEX coverage provide insight into its capital allocation efficacy and dividend coverage.
| Year | 2024 | 2023 | 2022 |
|---|---|---|---|
| Free Cash Flow Yield | 1.74% | 4.23% | 6.26% |
| Earnings Yield | 3.23% | 4.24% | 6.84% |
| CAPEX to Operating Cash Flow | 81.26% | 74.27% | 56.04% |
| Stock-based Compensation to Revenue | 0.38% | 0.40% | 0.27% |
| Free Cash Flow / Operating Cash Flow Ratio | 18.74% | 25.73% | 43.96% |
| Return on Invested Capital | 11.83% | 9.59% | 13.20% |
The declining free cash flow yield from 2022 to 2024 highlights potential challenges. Meanwhile, capital efficiency remains strong with robust returns on invested capital.
⚠️ Balance Sheet & Leverage Analysis
A company's leverage position impacts its financial stability and liquidity. Analyzing debt ratios and coverage provides a clear picture of its balance sheet strength and risk exposure.
| Year | 2024 | 2023 | 2022 |
|---|---|---|---|
| Debt-to-Equity | 550.26% | 474.88% | 433.84% |
| Debt-to-Assets | 62.75% | 62.94% | 59.13% |
| Debt-to-Capital | 84.62% | 82.61% | 81.27% |
| Net Debt to EBITDA | 3.41x | 3.25x | 3.53x |
| Current Ratio | 0.72 | 0.79 | 0.77 |
| Quick Ratio | 0.62 | 0.66 | 0.64 |
| Financial Leverage | 8.77 | 7.55 | 7.34 |
The high debt-to-equity ratio indicates substantial leverage, which increases financial risk but might be managed by stable interest coverage and operating efficiencies.
✅ Fundamental Strength & Profitability
Profitability metrics highlight a company's efficiency in generating returns. Strong margins and returns signify robust operational and financial management.
| Year | 2024 | 2023 | 2022 |
|---|---|---|---|
| Return on Equity | 48.97% | 30.23% | 42.85% |
| Return on Assets | 5.58% | 4.01% | 5.84% |
| Net Margin | 7.64% | 5.30% | 5.27% |
| EBIT Margin | 16.27% | 16.84% | 9.73% |
| EBITDA Margin | 24.89% | 25.39% | 14.80% |
| Gross Margin | 20.00% | 16.23% | 12.88% |
| R&D to Revenue | 0% | 0% | 0% |
Solid return metrics suggest Targa Resources is leveraging its assets effectively, but the absence of R&D investments may impact future innovation potential.
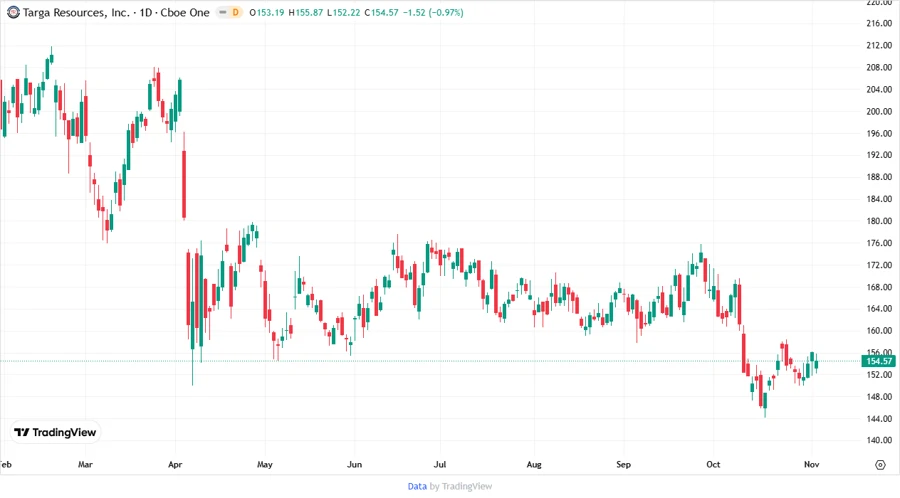
📉 Price Development
Dividend Scoring System
| Category | Score | Indicator |
|---|---|---|
| Dividend yield | 3/5 | |
| Dividend Stability | 4/5 | |
| Dividend growth | 2/5 | |
| Payout ratio | 3/5 | |
| Financial stability | 3/5 | |
| Dividend continuity | 4/5 | |
| Cashflow Coverage | 3/5 | |
| Balance Sheet Quality | 2/5 |
Total Score: 24/40
Rating
Overall, Targa Resources Corp. maintains a satisfactory dividend profile with steady payouts. However, the high leverage and absence of significant dividend growth over the recent years present potential risks. Investors should weigh these factors within the broader energy market context.
Smart Data Insight
Master the Perfect Entry & Exit for this Stock
Don't leave your profits to chance. Historically, this stock follows specific seasonal patterns that institutional traders use to maximize returns.
- ✅ Identify the "Golden Buying Window"
- ✅ Avoid high-risk correction cycles
- ✅ Backtested data from the last 20+ years