October 31, 2025 a 03:31 am
TRGP: Dividend Analysis - Targa Resources Corp.
Targa Resources Corp. presents a robust but evolving dividend profile that demands careful scrutiny. The company's moderate dividend yield and significant fluctuations in dividend growth over the past years are noteworthy, highlighting a need for stability. While it exhibits promising fundamentals, investors must be mindful of its payout ratios and leverage. Overall, Targa Resources offers an intriguing dividend opportunity with room for strategic improvements.
📊 Overview
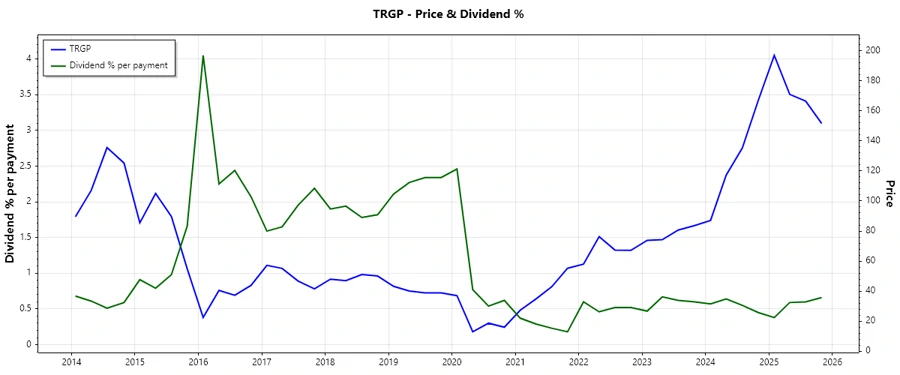
Targa Resources is positioned within a dynamic sector, demonstrating a moderate dividend yield reflective of its strategic financial management. The company's current dividend policy ensures a reasonable return to shareholders, albeit with historical disruptions.
| Sector | Dividend Yield | Current Dividend per Share | Dividend History | Last Cut or Suspension |
|---|---|---|---|---|
| Energy | 2.47% | 2.80 USD | 15 years | 2021 |
🗣️ Dividend History
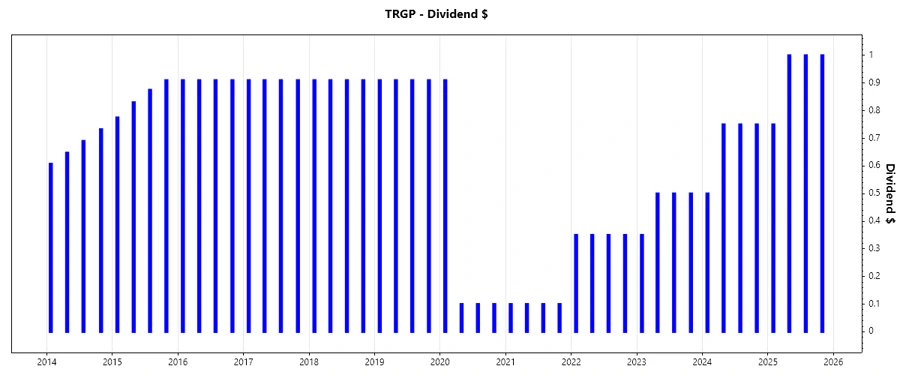
Targa Resources' dividend history over 15 years presents a pattern of resilience with periods of recalibration. This long-term consistency is vital for investor confidence, particularly following a recent adjustment in 2021.
| Year | Dividend Per Share (USD) |
|---|---|
| 2025 | 3.75 |
| 2024 | 2.75 |
| 2023 | 1.85 |
| 2022 | 1.40 |
| 2021 | 0.40 |
📈 Dividend Growth
Examining Targa Resources' dividend growth reveals inconsistency, with a notable decline over the last five years and a marginal gain over three years. Such patterns indicate the need for strategic enhancement to lure yield-focused investors.
| Time | Growth |
|---|---|
| 3 years | 0.90% |
| 5 years | -0.05% |
The average dividend growth is -0.05% over 5 years. This shows moderate but steady dividend growth.
📉 Payout Ratio
Analyzing payout ratios, Targa Resources shows a conservative approach based on EPS, yet exhibits a high FCF-based payout ratio, reflecting a potential strain on liquidity if cash flows do not improve.
| Key figure | Ratio |
|---|---|
| EPS-based | 39.72% |
| Free cash flow-based | 140.70% |
The EPS-based payout ratio of 39.72% suggests a disciplined dividend policy, whereas the FCF-based payout ratio of 140.70% indicates potential risk in maintaining dividend sustainability if operating cash flows do not meet expectations.
✅ Cashflow & Capital Efficiency
The company's capital efficiency metrics reveal an ongoing challenge with operational productivity and capital allocation. The CAPEX to operating cash flow and low free cash flow yield call for improved cost management to boost returns.
| Metric | 2024 | 2023 | 2022 |
|---|---|---|---|
| Free Cash Flow Yield | 1.74% | 4.23% | 6.26% |
| Earnings Yield | 3.23% | 4.24% | 6.84% |
| CAPEX to Operating Cash Flow | 81.26% | 74.27% | 56.04% |
| Stock-based Compensation to Revenue | 0.38% | 0.40% | 0.27% |
| Free Cash Flow / Operating Cash Flow Ratio | 18.74% | 25.73% | 43.96% |
While Targa Resources shows moderate cash flow efficiency, the need for shrewd capital management remains paramount to drive future earnings and shareholder value.
⚖️ Balance Sheet & Leverage Analysis
The company's balance sheet portrays a considerable leverage position, with high debt ratios pointing to increased risk. Efforts to manage capitalization and secure liquidity merit close shareholder attention.
| Metric | 2024 | 2023 | 2022 |
|---|---|---|---|
| Debt-to-Equity | 5.50 | 4.75 | 4.34 |
| Debt-to-Assets | 62.75% | 62.94% | 59.13% |
| Debt-to-Capital | 84.62% | 82.61% | 81.27% |
| Net Debt to EBITDA | 3.41 | 3.24 | 3.53 |
| Current Ratio | 0.72 | 0.79 | 0.77 |
| Quick Ratio | 0.62 | 0.66 | 0.64 |
| Financial Leverage | 8.77 | 7.55 | 7.34 |
High leverage ratios signify elevated financial risk, necessitating strategic debt management measures to enhance investor confidence and fiscal stability.
📊 Fundamental Strength & Profitability
Targa Resources demonstrates robust fundamentals, although return and margin metrics suggest room for efficiency improvements to cement long-term profitability.
| Metric | 2024 | 2023 | 2022 |
|---|---|---|---|
| Return on Equity | 48.97% | 30.23% | 42.85% |
| Return on Assets | 5.58% | 4.01% | 5.84% |
| Margins: Net | 7.64% | 5.30% | 5.27% |
| Margins: EBIT | 16.27% | 16.84% | 9.73% |
| Margins: EBITDA | 24.89% | 25.39% | 14.80% |
| Margins: Gross | 20.00% | 16.23% | 12.88% |
| Research & Development to Revenue | 0.00% | 0.00% | 0.00% |
Despite solid returns, the absence of R&D expenditure underscores a potential avenue for innovation investment to drive competitive edge and market relevance.
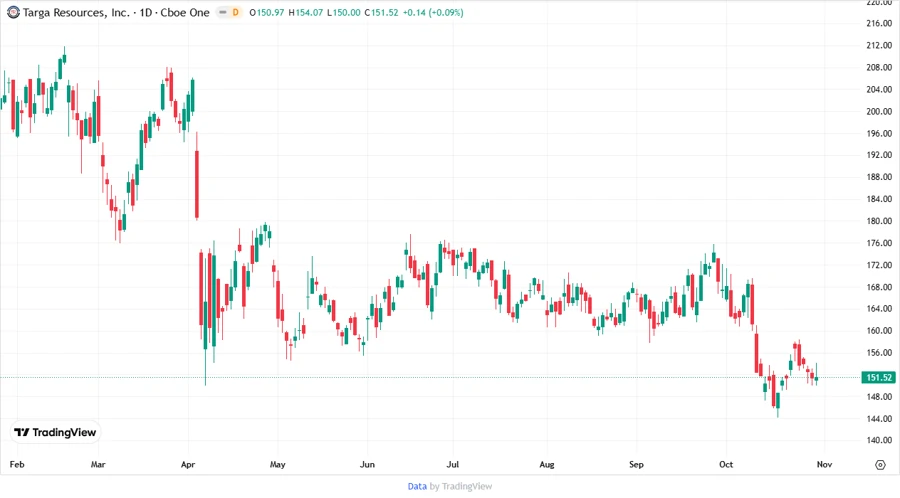
📉 Price Development
📊 Dividend Scoring System
| Category | Score (1-5) | Score Bar |
|---|---|---|
| Dividend yield | 3 | |
| Dividend Stability | 4 | |
| Dividend growth | 2 | |
| Payout ratio | 3 | |
| Financial stability | 2 | |
| Dividend continuity | 4 | |
| Cashflow Coverage | 2 | |
| Balance Sheet Quality | 3 |
Total Score: 23/40
✅ Rating
Targa Resources Corp. presents a diverse dividend profile for investors prioritizing long-term payouts. Its dividend yield, although moderate, is complemented by a history of resilience, albeit with recent volatility. While the company's operational and financial challenges need addressing to assure sustainable growth, its inherent market positioning remains compelling. Investors may find Targa Resources a viable addition to a balanced portfolio, focusing on potential capital appreciation and dividend collecting opportunities.
Smart Data Insight
Master the Perfect Entry & Exit for this Stock
Don't leave your profits to chance. Historically, this stock follows specific seasonal patterns that institutional traders use to maximize returns.
- ✅ Identify the "Golden Buying Window"
- ✅ Avoid high-risk correction cycles
- ✅ Backtested data from the last 20+ years