April 29, 2026 a 11:44 am
TPR: Fibonacci Analysis - Tapestry, Inc.
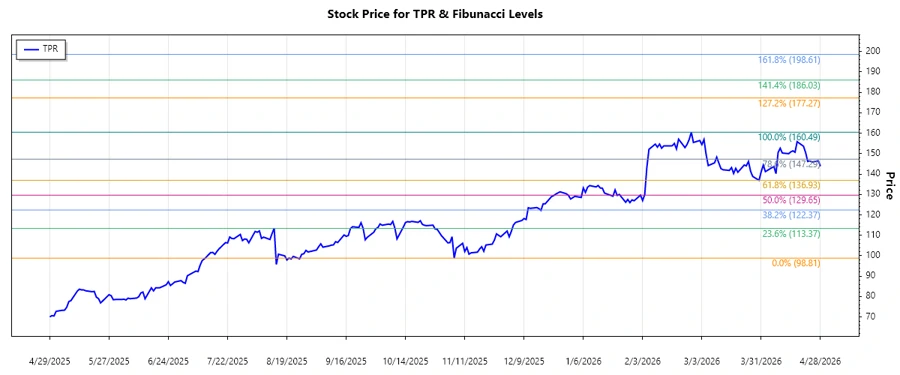
Tapestry, Inc. (Ticker: TPR) has experienced a notable uptrend over the recent months. With its diverse range of luxury accessories and brand segments such as Coach and Kate Spade, the company remains a strong contender in the international market. The recent trend suggests a growing interest in their product line, supported by robust e-commerce growth.
Fibonacci Analysis
| Detail | Value |
|---|---|
| Trend Start Date | 2025-11-05 |
| Trend End Date | 2026-04-27 |
| High Price (Date) | $160.49 (2026-02-26) |
| Low Price (Date) | $98.81 (2025-11-06) |
| Fibonacci Level 0.236 | $115.58 |
| Fibonacci Level 0.382 | $124.09 |
| Fibonacci Level 0.5 | $129.65 |
| Fibonacci Level 0.618 | $135.21 |
| Fibonacci Level 0.786 | $143.33 |
| Current Price | $143.84 |
| Retracement Zone | 0.786 |
| Interpretation | The current price is at the 0.786 Fibonacci level, indicating potential resistance. |
Conclusion
Tapestry, Inc.'s stock has shown resilience with a strong uptrend from late 2025 to early 2026. The stock has recently entered a critical Fibonacci retracement zone at 0.786, suggesting that this level might serve as resistance. A breakthrough past this level could suggest continued bullish momentum, while failure to breach might lead to consolidation or a reversal. Analysts should be cautious of market dynamics and external factors such as consumer sentiment in luxury spending. The technical indicators suggest an optimistic but cautious approach in the short term.