
July 15, 2026 a 03:31 pm

TPR: Dividend Analysis - Tapestry, Inc.
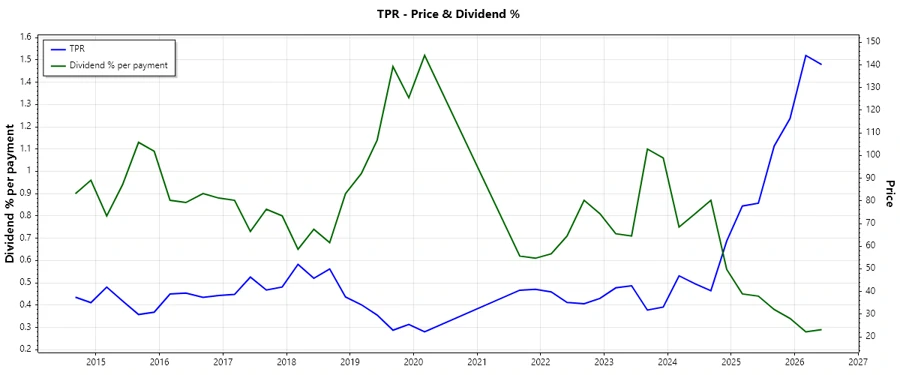
Tapestry, Inc. demonstrates a consistent dividend yield of 1.14%, reflecting a solid commitment to returning value to its shareholders. Despite some fluctuations due to historical market conditions, the company's focus on sustained growth is evident in its dividend strategies. As a key player in the Consumer Discretionary sector, Tapestry remains a viable option for income-focused investors.
Overview 📊
Analyzing Tapestry's dividend landscape provides insights into its financial health and capability to grow investor wealth. The following table summarizes key data points:
| Metric | Value |
|---|---|
| Sector | Consumer Discretionary |
| Dividend Yield | 1.14% |
| Current Dividend per Share | $1.38 |
| Dividend History | 18 years |
| Last Cut or Suspension | None |
Dividend History 🗓️
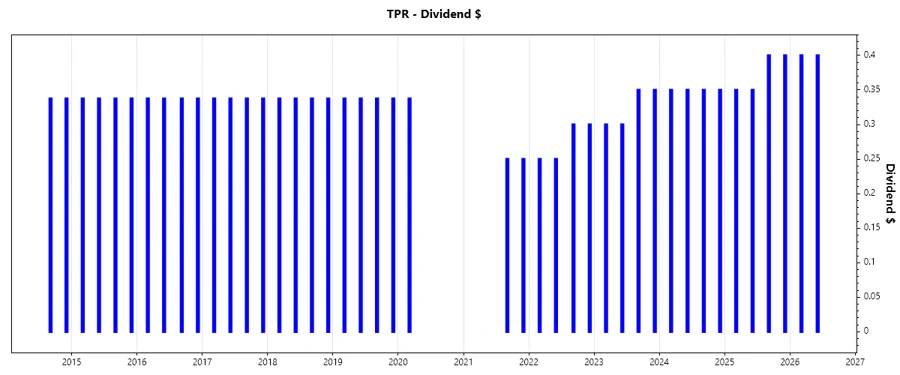
Tapestry has shown a commendable consistency in dividend payments over the last 18 years, indicative of its steadfast financial strategy in supporting shareholder returns. A visible pattern of stable to increasing dividends largely suggests positive market confidence.
| Year | Dividend per Share (USD) |
|---|---|
| 2026 | $0.80 |
| 2025 | $1.50 |
| 2024 | $1.40 |
| 2023 | $1.30 |
| 2022 | $1.10 |
Dividend Growth 📈
The growth of dividends is a pivotal indicator of Tapestry's expansion and profitability strategies. With a 3-year growth rate of 10.89% and a 5-year growth rate of 34.76%, there is a discernible upward trend, suggesting robust financial stewardship.
| Time | Growth |
|---|---|
| 3 years | 10.89% |
| 5 years | 34.76% |
The average dividend growth is 34.76% over 5 years. This shows moderate but steady dividend growth, underpinning the company's improving fiscal performance.
Payout Ratio 🧾
A sustainable payout ratio is crucial for maintaining current dividend levels and supporting future increases. Tapestry exhibits a secure EPS-based payout of 42.18% and a strong FCF-based payout of 15.89%.
| Key figure ratio | Value |
|---|---|
| EPS-based | 42.18% |
| Free Cash Flow-based | 15.89% |
The prudent payout ratios indicate a well-balanced approach to profit distribution, especially with the EPS and FCF percentages suggesting ample room for potential dividend enhancements.
Cashflow & Capital Efficiency 💵
Understanding cash flow strengths and capex management is essential. Here’s how Tapestry aligns with these principles:
| Year | 2025 | 2024 | 2023 |
|---|---|---|---|
| Free Cash Flow Yield | 5.79% | 11.91% | 7.82% |
| Earnings Yield | 0.97% | 8.48% | 9.25% |
| CAPEX to Operating Cash Flow | 10.09% | 8.67% | 18.89% |
| Stock-based Compensation to Revenue | 1.24% | 1.29% | 1.18% |
| Free Cash Flow / Operating Cash Flow Ratio | 89.91% | 91.33% | 81.12% |
The steady cash flow and capital efficiency reinforce Tapestry's ability to support dividends alongside growth initiatives, evidencing astute fiscal management.
Balance Sheet & Leverage Analysis 🏦
Assessing leverage and financial health is vital for future stability. Tapestry's holistic approach to debt management is apparent:
| Year | 2025 | 2024 | 2023 |
|---|---|---|---|
| Debt-to-Equity | 4.55 | 3.03 | 1.45 |
| Debt-to-Assets | 0.59 | 0.65 | 0.46 |
| Debt-to-Capital | 0.82 | 0.75 | 0.59 |
| Net Debt to EBITDA | 5.32 | 1.92 | 1.84 |
| Current Ratio | 1.87 | 5.14 | 1.84 |
| Quick Ratio | 1.31 | 4.66 | 1.12 |
| Financial Leverage | 7.67 | 4.62 | 3.12 |
Tapestry's leverage profile is strategically improving, indicating resourceful risk management that offers security to dividend policies.
Fundamental Strength & Profitability 📊
Profitability metrics detail the company's capability to generate returns and maintain competitive positioning:
| Year | 2025 | 2024 | 2023 |
|---|---|---|---|
| Return on Equity | 21.36% | 28.17% | 41.09% |
| Return on Assets | 2.78% | 6.09% | 13.15% |
| Net Margin | 2.61% | 12.23% | 14.05% |
| EBIT Margin | 4.30% | 17.04% | 17.58% |
| EBITDA Margin | 7.51% | 20.47% | 20.94% |
| Gross Margin | 75.44% | 73.29% | 70.78% |
| R&D to Revenue | 0.00% | 0.00% | 0.00% |
The rising ROE and consistent gross margins are testaments to Tapestry's proficient utilization of assets and equity, bolstering long-term investor confidence.
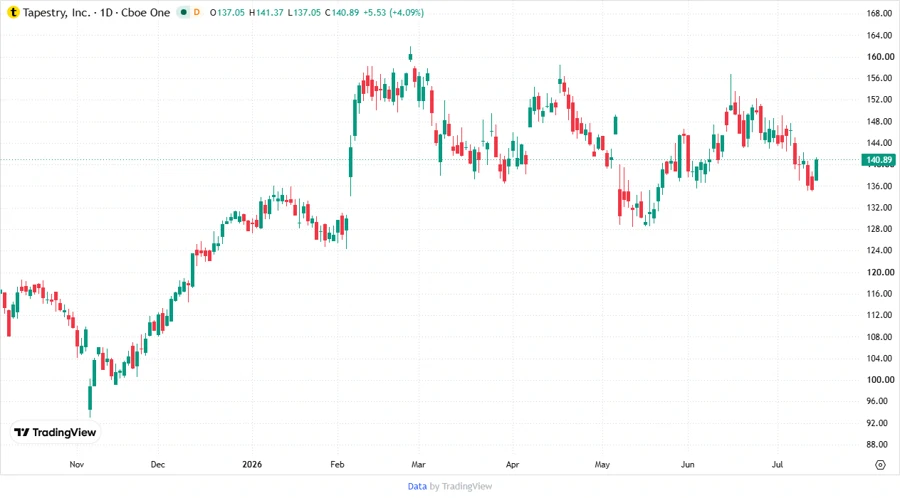
Price Development 📉
Dividend Scoring System 🏅
| Category | Score | Score Bar |
|---|---|---|
| Dividend Yield | 3 | |
| Dividend Stability | 4 | |
| Dividend Growth | 4 | |
| Payout Ratio | 4 | |
| Financial Stability | 4 | |
| Dividend Continuity | 5 | |
| Cashflow Coverage | 4 | |
| Balance Sheet Quality | 4 |
Total Score: 32/40
Rating ⭐
Tapestry, Inc. provides a strong dividend profile characterized by stability and growing yields, making it an attractive option for income investors. Prospective growth, founded on robust financials and moderate leverage, enhances its desirability. Recommended as a 'Buy' for long-term revenue generation with monitored market conditions.
Smart Data Insight
Master the Perfect Entry & Exit for this Stock
Don't leave your profits to chance. Historically, this stock follows specific seasonal patterns that institutional traders use to maximize returns.
- ✅ Identify the "Golden Buying Window"
- ✅ Avoid high-risk correction cycles
- ✅ Backtested data from the last 20+ years