June 11, 2026 a 12:46 pm


TPR: Dividend Analysis - Tapestry, Inc.
Tapestry, Inc. presents a stable dividend profile with notable growth trends over the past years. With a modest yet steady dividend yield and a reliable payout ratio, the company appeals to investors seeking balance between growth and income. Its financial discipline and strategic dividends underscore its commitment to shareholder returns.
📊 Overview
Tapestry, Inc., is a key player in the luxury goods sector, demonstrating a robust dividend performance. Here's a detailed snapshot:
| Metric | Details |
|---|---|
| Sector | Luxury Goods |
| Dividend yield | 1.14 % |
| Current dividend per share | 1.38 USD |
| Dividend history | 18 years |
| Last cut or suspension | None |
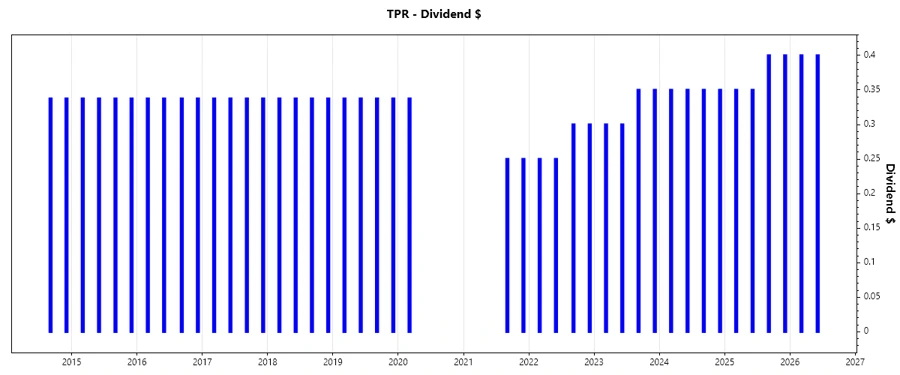
📈 Dividend History
The firm's consistent dividend payments over the years highlight its commitment to returning capital to shareholders. This history is crucial for evaluating reliability.
| Year | Dividend Per Share (USD) |
|---|---|
| 2026 | 0.80 |
| 2025 | 1.50 |
| 2024 | 1.40 |
| 2023 | 1.30 |
| 2022 | 1.10 |
📈 Dividend Growth
Dividend growth is a key indicator of the company's ability to increase shareholder returns over time. Tapestry, Inc., has demonstrated consistent growth:
| Time | Growth |
|---|---|
| 3 years | 10.89 % |
| 5 years | 34.76 % |
The average dividend growth is 34.76 % over 5 years. This shows moderate but steady dividend growth.
📊 Payout Ratio
The payout ratio reveals the sustainability of dividend payments based on company earnings. A balanced payout ratio enhances dividend security.
| Key figure | Ratio |
|---|---|
| EPS-based | 42.18 % |
| Free cash flow-based | 15.89 % |
The EPS payout ratio of 42.18 % suggests a conservative approach, leaving room for growth and crisis management, while the FCF-based payout ratio of 15.89 % indicates ample coverage by cash flow.
Cashflow & Capital Efficiency
Understanding cash flow dynamics and capital allocation provides insights into operational efficiency and value creation.
| Metric | 2023 | 2024 | 2025 |
|---|---|---|---|
| Free Cash Flow Yield | 7.82 % | 11.91 % | 5.79 % |
| Earnings Yield | 9.25 % | 8.48 % | 0.97 % |
| CAPEX to Operating Cash Flow | 18.89 % | 8.67 % | 10.09 % |
| Stock-based Compensation to Revenue | 1.18 % | 1.29 % | 1.25 % |
| Free Cash Flow / Operating Cash Flow Ratio | 81.11 % | 91.33 % | 89.91 % |
Strong free cash flow yield and efficient CAPEX allocation signify healthy cash flow management, supporting continued financial stability.
Balance Sheet & Leverage Analysis
A robust balance sheet and prudent leverage ratios enhance financial resilience and facilitate strategic growth.
| Metric | 2023 | 2024 | 2025 |
|---|---|---|---|
| Debt-to-Equity | 1.45 | 3.03 | 4.55 |
| Debt-to-Assets | 0.46 | 0.65 | 0.59 |
| Debt-to-Capital | 0.59 | 0.75 | 0.82 |
| Net Debt to EBITDA | 1.84 | 1.92 | 5.32 |
| Current Ratio | 1.84 | 5.14 | 1.87 |
| Quick Ratio | 1.12 | 4.66 | 1.31 |
| Financial Leverage | 3.12 | 4.62 | 7.67 |
The company's leverage ratios point to a balanced capital structure, facilitating both operational and financial stability.
Fundamental Strength & Profitability
Core profitability metrics underscore the firm's efficiency in generating returns and managing expenses.
| Metric | 2023 | 2024 | 2025 |
|---|---|---|---|
| Return on Equity | 41.09 % | 28.17 % | 21.36 % |
| Return on Assets | 13.15 % | 6.09 % | 2.78 % |
| Net Profit Margin | 14.05 % | 12.23 % | 2.61 % |
| EBIT Margin | 17.58 % | 17.04 % | 4.30 % |
| EBITDA Margin | 20.94 % | 20.47 % | 7.51 % |
| Gross Margin | 70.78 % | 73.29 % | 75.44 % |
| Research & Development to Revenue | 0 % | 0 % | 0 % |
The profitability metrics indicate that Tapestry, Inc. has effectively managed its operational expenses and capital, ensuring strong margins and returns on investment.
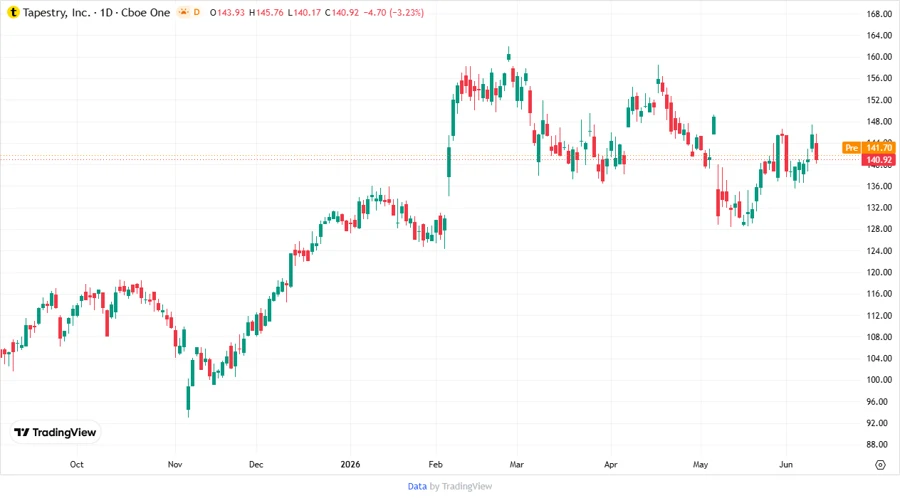
Price Development
Dividend Scoring System
Tapestry, Inc. undergoes evaluation based on various dividend-related metrics to form a holistic view of its attractiveness to dividend investors.
| Criteria | Score | Indicator |
|---|---|---|
| Dividend yield | 3 | |
| Dividend Stability | 4 | |
| Dividend growth | 4 | |
| Payout ratio | 5 | |
| Financial stability | 4 | |
| Dividend continuity | 5 | |
| Cashflow Coverage | 4 | |
| Balance Sheet Quality | 3 |
Total Score: 32/40
Rating
Overall, Tapestry, Inc. presents a compelling case for dividend-seeking investors, offering a balance of yield, stability, and growth potential. The company's robust financials and strategic approach to capital management make it a recommended investment for diversified portfolio enhancement.
Smart Data Insight
Master the Perfect Entry & Exit for this Stock
Don't leave your profits to chance. Historically, this stock follows specific seasonal patterns that institutional traders use to maximize returns.
- ✅ Identify the "Golden Buying Window"
- ✅ Avoid high-risk correction cycles
- ✅ Backtested data from the last 20+ years