November 15, 2025 a 12:46 pm

TPR: Dividend Analysis - Tapestry, Inc.
Tapestry, Inc. has shown a commendable commitment to its dividend policy, maintaining a consistent distribution over the years. With a market capitalization of over $21 billion, it signifies stability, though recent payout ratios indicate a need for careful monitoring. The dividend history portrays resilience, especially after the 2020 suspension. The company's ability to sustain dividends in the long term will be essential for investor confidence.
📊 Overview
The following provides a concise overview of Tapestry, Inc.'s dividend-related key parameters. Highlights include the company's sector segmentation and noteworthy aspects such as dividend yield and payout consistency.
| Parameter | Value |
|---|---|
| Sector | Consumer Discretionary |
| Dividend yield | 1.48 % |
| Current dividend per share | 1.38 USD |
| Dividend history | 17 years |
| Last cut or suspension | 2020 |
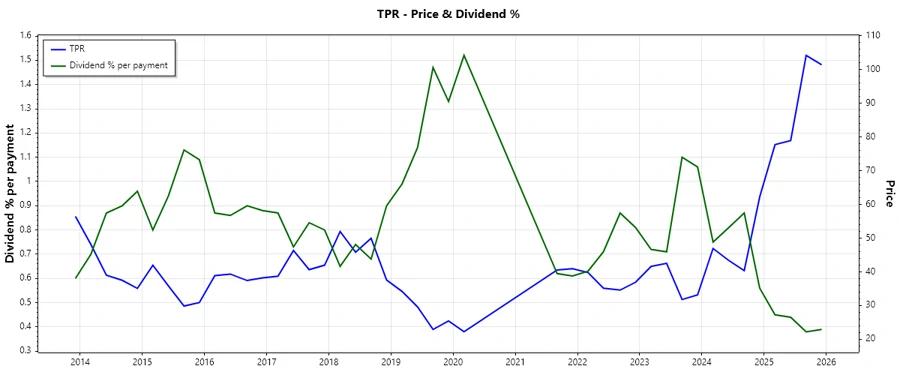
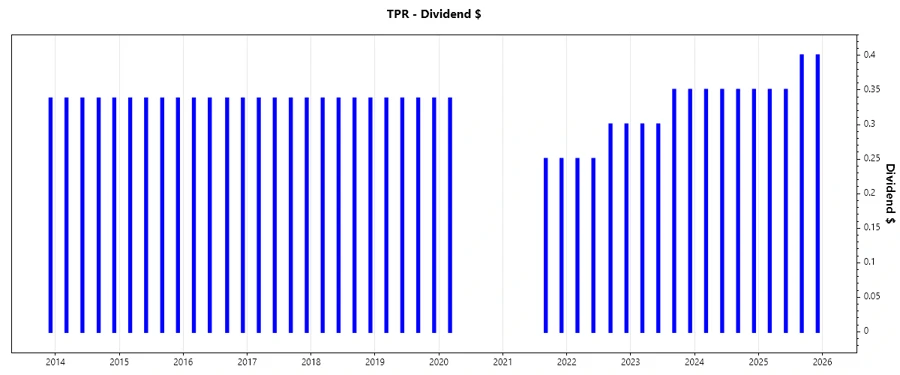
🗣️ Dividend History
Understanding Tapestry's dividend history is crucial to gauge the sustainability and reliability of future payouts. Despite a suspension in 2020, the company has returned to a growth trajectory, reinforcing its commitment to shareholders.
| Year | Dividend per Share |
|---|---|
| 2025 | 1.50 USD |
| 2024 | 1.40 USD |
| 2023 | 1.30 USD |
| 2022 | 1.10 USD |
| 2021 | 0.50 USD |
📈 Dividend Growth
Sustained growth in dividends is indicative of a company's operational success and profitability. Tapestry's dividend growth metrics over recent years underline its ability to increase shareholder returns.
| Time | Growth |
|---|---|
| 3 years | 0.4 % |
| 5 years | 0.73 % |
The average dividend growth is 0.73% over 5 years. This shows moderate but steady dividend growth.
✅ Payout Ratio
Payout ratios provide a lens to assess the feasibility of continued dividend payments. Particularly, Tapestry’s EPS-based and FCF-based payout ratios draw attention to its strategic financial management.
| Key figure | Ratio |
|---|---|
| EPS-based | 109.21 % |
| Free cash flow-based | 26.94 % |
The high EPS-based payout ratio raises concerns over sustainability, while the FCF-based ratio suggests adequate cash flow support.
⚖️ Cashflow & Capital Efficiency
Robust cash flow and capital efficiency highlight a firm’s financial health, critical for sustaining dividends. Below, Tapestry's metrics offer an insight into its operational and financial dynamics.
| Metric | 2025 | 2024 | 2023 |
|---|---|---|---|
| Free Cash Flow Yield | 5.79% | 11.91% | 7.82% |
| Earnings Yield | 0.97% | 8.48% | 9.25% |
| CAPEX to Operating Cash Flow | 10.71% | 8.67% | 18.88% |
| Stock-based Compensation to Revenue | 1.25% | 1.29% | 1.18% |
| Free Cash Flow / Operating Cash Flow Ratio | 89.91% | 91.33% | 81.12% |
Overall, Tapestry exhibits a solid cash flow performance, with efficient capital allocation as indicated by low CAPEX relative to cash flow.
🏦 Balance Sheet & Leverage Analysis
The strength of a company's balance sheet and leverage position provides crucial insight into its financial resilience. Tapestry's leverage metrics reveal compelling information about its debt obligations and asset management.
| Metric | 2025 | 2024 | 2023 |
|---|---|---|---|
| Debt-to-Equity | 4.54 | 3.03 | 1.45 |
| Debt-to-Assets | 0.59 | 0.65 | 0.46 |
| Debt-to-Capital | 0.82 | 0.75 | 0.59 |
| Net Debt to EBITDA | 5.99 | 1.92 | 1.84 |
| Current Ratio | 1.87 | 5.14 | 1.84 |
| Quick Ratio | 1.31 | 4.66 | 1.12 |
| Financial Leverage | 7.67 | 4.62 | 3.12 |
The relatively high leverage ratios in recent years call for careful evaluation, though the company's current liquidity remains sufficient to manage obligations.
🚀 Fundamental Strength & Profitability
Tapestry's profitability metrics demonstrate its core business strength. Analyzing parameters like return on equity and asset margins highlights its operational efficiency.
| Metric | 2025 | 2024 | 2023 |
|---|---|---|---|
| Return on Equity | 21.36% | 28.17% | 41.09% |
| Return on Assets | 2.78% | 6.09% | 13.15% |
| Margins: Net | 2.61% | 12.23% | 14.05% |
| Margins: EBIT | 4.30% | 17.04% | 17.58% |
| Margins: EBITDA | 7.51% | 20.47% | 20.94% |
Tapestry's robust profitability ratios reflect its superior ability to generate earnings relative to its peer group, underpinning shareholder value.
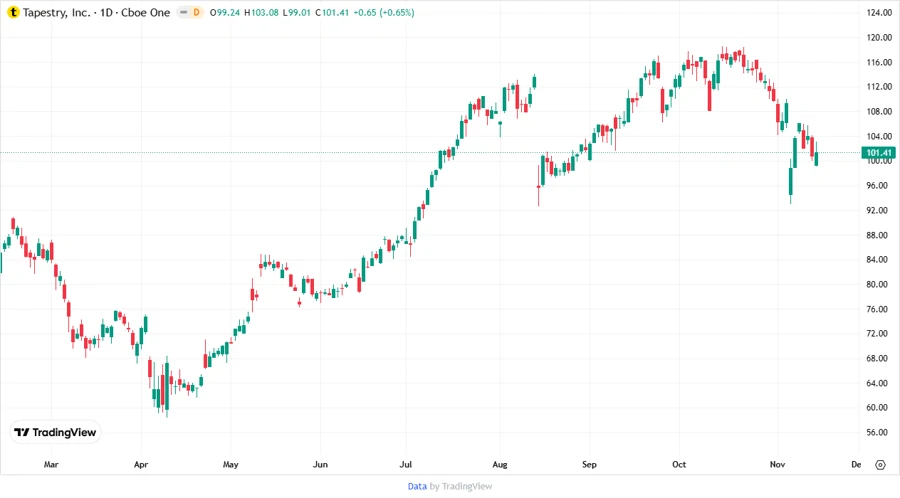
📉 Price Development
⚠️ Dividend Scoring System
| Criteria | Score | Visualization |
|---|---|---|
| Dividend yield | 3 | |
| Dividend Stability | 3 | |
| Dividend growth | 2 | |
| Payout ratio | 2 | |
| Financial stability | 3 | |
| Dividend continuity | 4 | |
| Cashflow Coverage | 4 | |
| Balance Sheet Quality | 3 |
Total Score: 24/40
💬 Rating
In conclusion, Tapestry, Inc. offers a reasonably stable dividend proposition with moderate growth potential. Investors should weigh the high EPS payout against its robust free cash flow, paying attention to leverage ratios. Overall, Tapestry may be considered for a diversified income portfolio with a watchful eye on its financial adjustments towards sustainable growth.
Smart Data Insight
Master the Perfect Entry & Exit for this Stock
Don't leave your profits to chance. Historically, this stock follows specific seasonal patterns that institutional traders use to maximize returns.
- ✅ Identify the "Golden Buying Window"
- ✅ Avoid high-risk correction cycles
- ✅ Backtested data from the last 20+ years