November 01, 2025 a 11:31 am
TPR: Dividend Analysis - Tapestry, Inc.
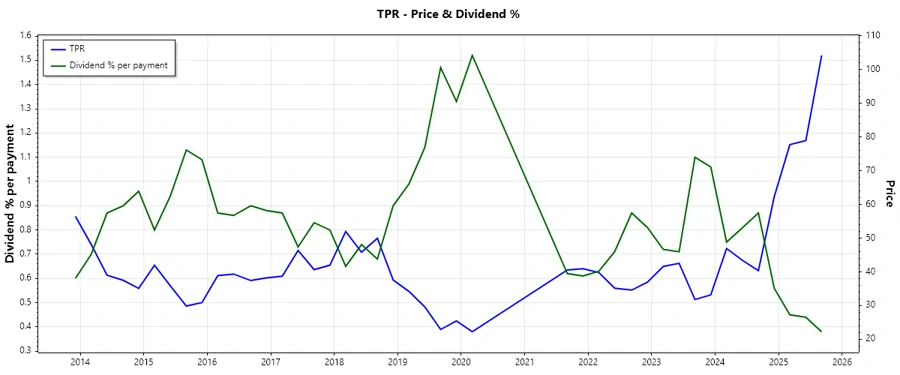
Tapestry, Inc. exhibits a stable dividend history with a current dividend yield of 1.39%. Despite a high EPS payout ratio indicating aggressive dividend distributions relative to earnings, the free cash flow payout ratio is moderately healthy. The company has shown resilience, with robust financial strength indicators over the past years, promising sustainability in dividend payouts.
📊 Overview
Tapestry, Inc. operates within the consumer discretionary sector, revealing a dividend yield of 1.39%. The current dividend per share is marked at $1.38, emphasizing a steadfast 17-year history of dividend payments without recent suspensions. This steadfastness underscores the company's commitment to returning value to its shareholders.
| Metric | Value |
|---|---|
| Sector | Consumer Discretionary |
| Dividend Yield | 1.39% |
| Current Dividend per Share | $1.38 |
| Dividend History | 17 years |
| Last Cut/Suspension | None |
📈 Dividend History
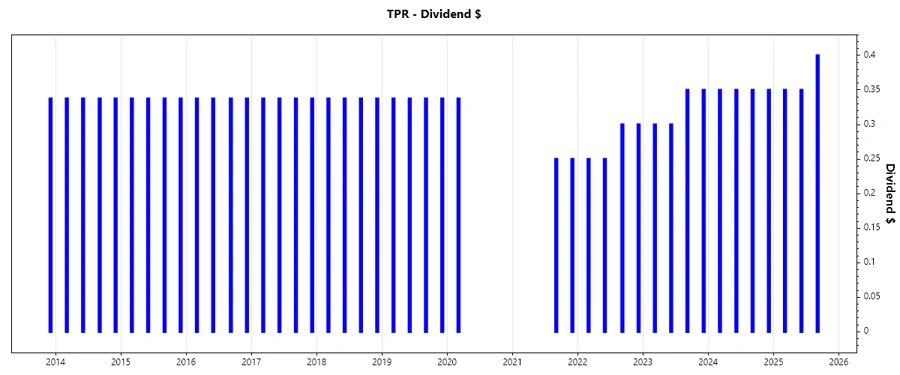
The uninterrupted 17-year dividend history of Tapestry, Inc. underlines its strong shareholder value orientation. Understanding history helps predict future distributions, providing investors with confidence in the company's reliability.
| Year | Dividend per Share (USD) |
|---|---|
| 2025 | $1.10 |
| 2024 | $1.40 |
| 2023 | $1.30 |
| 2022 | $1.10 |
| 2021 | $0.50 |
💼 Dividend Growth
The analysis of Dividend growth is fundamental as it demonstrates the company's potential to increase payouts over time. It is crucial for investors seeking increasing income streams from dividends.
| Time | Growth |
|---|---|
| 3 years | 0.41% |
| 5 years | 0.73% |
The average dividend growth is 0.73% over 5 years. This shows moderate but steady dividend growth.
📉 Payout Ratio
The payout ratio is a critical indicator of dividend sustainability. A high EPS-based ratio may signal strain on earnings, whereas the free cash flow-based ratio appears more balanced.
| Key figure | Ratio |
|---|---|
| EPS-based | 156.59% |
| Free cash flow-based | 26.27% |
While the EPS-based payout ratio of 156.59% is concerning, indicating potential vulnerability, the free cash flow-based ratio at 26.27% warrants a more secure outlook on the company’s ability to finance dividends from its operational cash flow.
🌊 Cashflow & Capital Efficiency
Cash flow and capital efficiency metrics are pivotal in assessing a company's liquidity and long-term viability in sustaining dividend payments. They focus on the firm's ability to convert investments into returns and maintain operational flexibility.
| Metric | 2023 | 2024 | 2025 |
|---|---|---|---|
| Free Cash Flow Yield | 7.82% | 11.69% | 5.79% |
| Earnings Yield | 9.25% | 8.32% | 0.97% |
| CAPEX to Operating Cash Flow | 18.89% | 8.67% | 10.09% |
| Stock-based Compensation to Revenue | 1.18% | 1.29% | 1.25% |
| Free Cash Flow / Operating Cash Flow Ratio | 81.11% | 91.33% | 89.91% |
The stable cash flow and capital efficiency ratios suggest a competent management of resources, which reflects positively on the company’s ability to maintain dividend payments and signal solid capital allocation strategies.
🏦 Balance Sheet & Leverage Analysis
The balance sheet and leverage ratios provide insights into the company’s capital structure and financial health, which are pivotal for evaluating its ability to manage debt and leverage to foster growth while sustaining dividends.
| Metric | 2023 | 2024 | 2025 |
|---|---|---|---|
| Debt-to-Equity | 1.45 | 3.03 | 4.55 |
| Debt-to-Assets | 0.46 | 0.65 | 0.59 |
| Debt-to-Capital | 0.59 | 0.75 | 0.82 |
| Net Debt to EBITDA | 1.84 | 1.92 | 5.32 |
| Current Ratio | 1.84 | 5.14 | 1.87 |
| Quick Ratio | 1.12 | 4.66 | 1.31 |
| Financial Leverage | 3.12 | 4.62 | 7.67 |
Though the leverage ratios indicate increased debt levels, the substantial EBITDA coverage ratio implies manageable financial obligations, albeit conservative management of debt would be advised to enhance future flexibility.
🔍 Fundamental Strength & Profitability
Evaluating profitability ratios helps assess the effectiveness of a company's operation, further supporting its ability to generate profits to sustain and grow dividend payments.
| Metric | 2023 | 2024 | 2025 |
|---|---|---|---|
| Return on Equity | 41.09% | 28.17% | 21.36% |
| Return on Assets | 13.15% | 6.09% | 2.78% |
| Margins: Net | 14.05% | 12.23% | 2.61% |
| EBIT | 17.58% | 17.04% | 4.30% |
| EBITDA | 20.94% | 20.47% | 7.51% |
| Gross | 70.78% | 73.29% | 75.44% |
| R&D to Revenue | 0% | 0% | 0% |
The fundamental strength reflected by solid profitability margins signals a competitive business model and operational efficiency, key to sustaining dividend payments and shareholder returns.
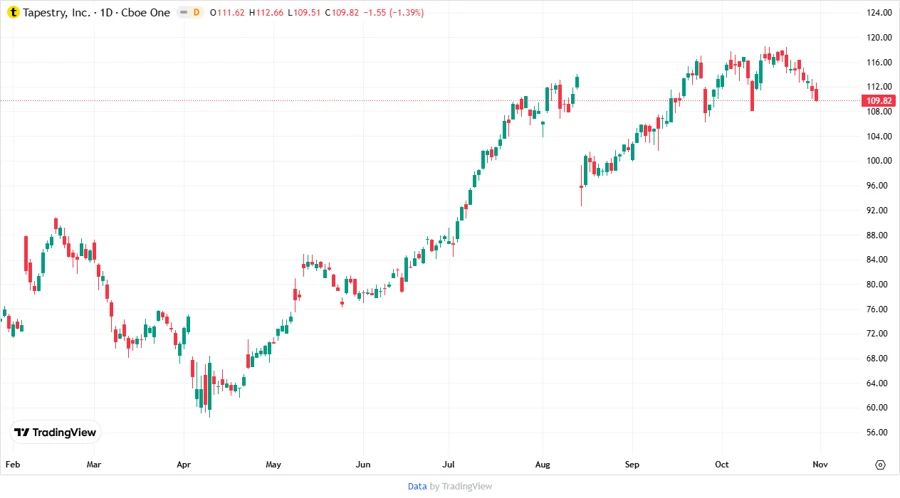
📉 Price Development
✅ Dividend Scoring System
| Criterion | Score | Scale |
|---|---|---|
| Dividend Yield | 3 | |
| Dividend Stability | 4 | |
| Dividend Growth | 2 | |
| Payout Ratio | 3 | |
| Financial Stability | 3 | |
| Dividend Continuity | 4 | |
| Cashflow Coverage | 4 | |
| Balance Sheet Quality | 2 |
Total Score: 25/40
🗣️ Rating
Tapestry, Inc. offers a stable dividend with a reasonable yield, backed by a solid 17-year history of payouts. However, the high EPS payout ratio and signs of elevated leverage necessitate cautious optimism. The moderate dividend growth and secure cash flow coverage imply a sustainable, albeit conservative, dividend policy. Investors seeking consistent income should find Tapestry, Inc. a viable, though moderately risky, investment for yield generation.
Smart Data Insight
Master the Perfect Entry & Exit for this Stock
Don't leave your profits to chance. Historically, this stock follows specific seasonal patterns that institutional traders use to maximize returns.
- ✅ Identify the "Golden Buying Window"
- ✅ Avoid high-risk correction cycles
- ✅ Backtested data from the last 20+ years