October 12, 2025 a 07:31 am

TPR: Dividend Analysis - Tapestry, Inc.
Tapestry, Inc., a prominent player in the consumer discretionary sector, showcases a balanced dividend profile with a yield of 1.39%. With a steadfast dividend history spanning 17 years and recent increases, it remains a stable choice for income-focused investors. However, a payout ratio of over 156% against EPS raises sustainability concerns.
📊 Overview
Tapestry, Inc. operates within the consumer discretionary sector, exhibiting a noteworthy dividend yield of 1.39%. It has maintained its dividend history for 17 years. The absence of recent dividend cuts or suspensions indicates a commitment to shareholder returns. Here is a snapshot of their current position:
| Detail | Value |
|---|---|
| Sector | Consumer Discretionary |
| Dividend yield | 1.39% |
| Current dividend per share | 1.38 USD |
| Dividend history | 17 years |
| Last cut or suspension | None |
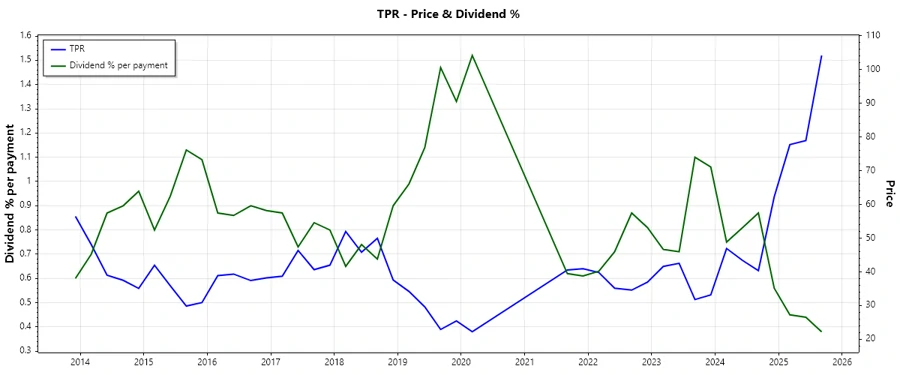
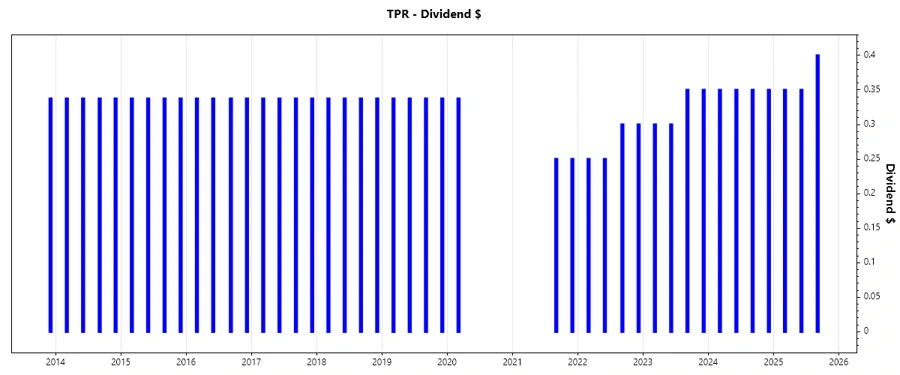
🗣️ Dividend History
The dividend history of a company serves as a vital indicator of its commitment to returning capital to shareholders. A consistent and growing dividend record suggests stable cash generation and financial health.
| Year | Dividend per Share (USD) |
|---|---|
| 2025 | 1.10 |
| 2024 | 1.40 |
| 2023 | 1.30 |
| 2022 | 1.10 |
| 2021 | 0.50 |
📈 Dividend Growth
The dividend growth rate reflects the company's potential for increasing payout amounts over time, indicating a positive trend for dividend enthusiasts.
| Time | Growth |
|---|---|
| 3 years | 0.41% |
| 5 years | 0.73% |
The average dividend growth is 0.73% over 5 years. This shows moderate but steady dividend growth.
📉 Payout Ratio
Payout ratios are a cornerstone for assessing the sustainability of dividend payments. A very high payout ratio may limit future dividend growth and increase cut risk.
| Key figure | Ratio |
|---|---|
| EPS-based | 156.59% |
| Free cash flow-based | 26.27% |
The EPS payout ratio of 156.59% is considerably high, suggesting that the company may not generate enough earnings to cover its dividend payments sustainably. In contrast, a more comfortable 26.27% ratio based on free cash flow indicates better coverage.
✅ Cashflow & Capital Efficiency
Strong cash flows and efficient capital use are crucial for sustaining dividend payouts and driving shareholder value.
| Metric | 2023 | 2024 | 2025 |
|---|---|---|---|
| Free Cash Flow Yield | 7.82% | 11.69% | 5.79% |
| Earnings Yield | 9.25% | 8.32% | 0.97% |
| CAPEX to Operating Cash Flow | 18.88% | 8.67% | 10.09% |
| Stock-based Compensation to Revenue | 1.18% | 1.29% | 1.25% |
| Free Cash Flow / Operating Cash Flow Ratio | 81.11% | 91.33% | 89.91% |
Consistent free cash flow generation and low CAPEX to operating cash flow ratios indicate robust cash flow management, facilitating ongoing dividend support.
⚠️ Balance Sheet & Leverage Analysis
A healthy balance sheet and appropriate leverage are critical for financial resilience and delivering long-term shareholder value.
| Metric | 2023 | 2024 | 2025 |
|---|---|---|---|
| Debt-to-Equity | 1.45 | 3.03 | 4.55 |
| Debt-to-Assets | 46.26% | 65.42% | 59.25% |
| Debt-to-Capital | 59.10% | 75.16% | 81.97% |
| Net Debt to EBITDA | 1.84 | 1.92 | 5.32 |
| Current Ratio | 1.84 | 5.14 | 1.87 |
| Quick Ratio | 1.12 | 4.66 | 1.31 |
| Financial Leverage | 3.12 | 4.62 | 7.67 |
A rising debt-to-equity ratio coupled with high financial leverage suggests increased financial risk. However, strong liquidity ratios indicate short-term stability.
📊 Fundamental Strength & Profitability
Profitability ratios reveal insights into a company’s efficiency in generating profits and sustaining earnings growth.
| Metric | 2023 | 2024 | 2025 |
|---|---|---|---|
| Return on Equity | 41.09% | 28.17% | 21.36% |
| Return on Assets | 13.15% | 6.09% | 2.78% |
| Net Margin | 14.05% | 12.23% | 2.61% |
| EBIT Margin | 17.58% | 17.04% | 4.30% |
| EBITDA Margin | 20.94% | 20.47% | 7.51% |
| Gross Margin | 70.78% | 73.29% | 75.44% |
| R&D to Revenue | 0% | 0% | 0% |
While RoE and net margin deterioration indicate potential challenges, strong gross margins reflect operational efficiency.
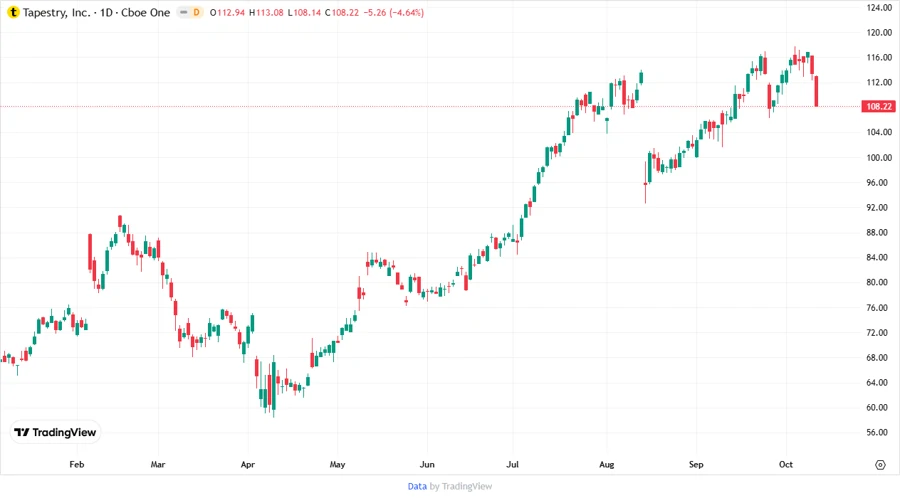
📈 Price Development
Dividend Scoring System
| Category | Score | Indicator |
|---|---|---|
| Dividend yield | 3 | |
| Dividend Stability | 4 | |
| Dividend growth | 2 | |
| Payout ratio | 2 | |
| Financial stability | 3 | |
| Dividend continuity | 4 | |
| Cashflow Coverage | 4 | |
| Balance Sheet Quality | 2 |
Overall Score: 24/40
Rating
In summation, Tapestry, Inc. maintains a respectable position in the dividend landscape with consistent past payouts but faces challenges with sustainability indicated by a high EPS payout ratio. Prudent investors should weigh the firm's strong historical trend with its financial ratios for a holistic investment decision.
Smart Data Insight
Master the Perfect Entry & Exit for this Stock
Don't leave your profits to chance. Historically, this stock follows specific seasonal patterns that institutional traders use to maximize returns.
- ✅ Identify the "Golden Buying Window"
- ✅ Avoid high-risk correction cycles
- ✅ Backtested data from the last 20+ years