August 13, 2025 a 03:31 am
TPR: Dividend Analysis - Tapestry, Inc.
Tapestry, Inc. offers a stable dividend profile with regular payments over the last 17 years, demonstrating a strong commitment to rewarding its shareholders. However, the company's recent dividend growth has been modest, indicating potential limitations in its expansion strategy. Investors seeking long-term income might consider Tapestry, Inc. as a moderate but reliable investment option.
📊 Overview
Tapestry, Inc., operating in the Retail sector, boasts a dividend yield of 1.77%, with a current dividend per share of 1.40 USD. Its 17-year history of dividend payments underscores a reputable record of shareholder returns, although the last cut or suspension was noted as none, showcasing resilience through market fluctuations.
| Sector | Dividend yield | Current dividend per share | Dividend history | Last cut or suspension |
|---|---|---|---|---|
| Retail | 1.77% | 1.40 USD | 17 years | None |
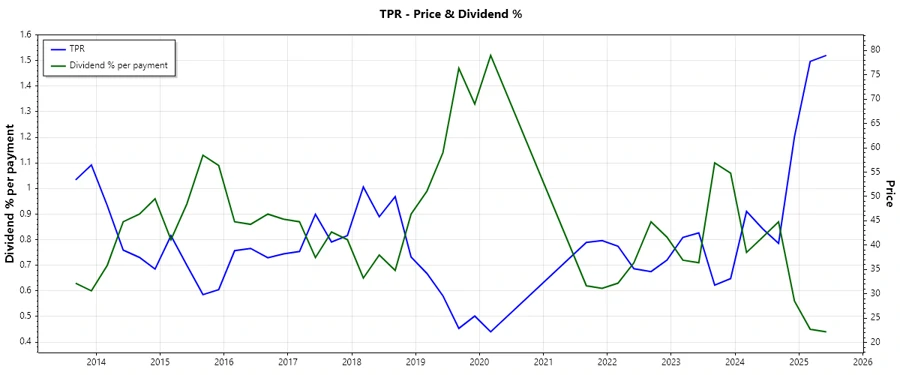
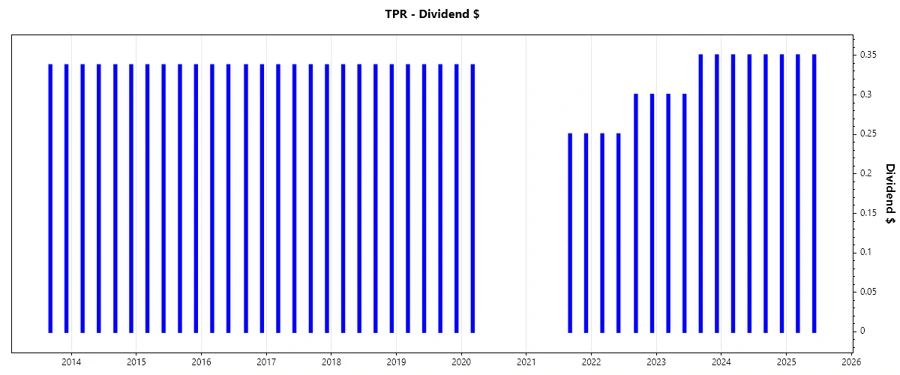
🗣️ Dividend History
This section reflects Tapestry's dividend resilience, emphasizing its prolonged history of payments. Consistent dividend policies build investor trust and support stockholder income strategies.
| Year | Dividend per Share (USD) |
|---|---|
| 2025 | 0.70 |
| 2024 | 1.40 |
| 2023 | 1.30 |
| 2022 | 1.10 |
| 2021 | 0.50 |
📈 Dividend Growth
Dividend growth statistics from recent years suggest steady, albeit slow improvements, which signifies stability yet limited aggressive growth potential.
| Time | Growth |
|---|---|
| 3 years | 0.41% |
| 5 years | 0.73% |
The average dividend growth is 0.73% over 5 years. This shows moderate but steady dividend growth.
📉 Payout Ratio
A deep dive into payout ratios reveals insights into the company's ability to sustain its dividends without jeopardizing its reinvestment opportunities. Tapestry's payout ratio, based on EPS, stands at an attractive 33.82%, while the Free Cash Flow-based payout ratio is 32.64%. These figures suggest that the dividend is well-covered and sustainable given current earnings.
| Key figure | Ratio |
|---|---|
| EPS-based | 33.82% |
| Free cash flow-based | 32.64% |
The company maintains a balanced approach by keeping the payout ratios in check, ensuring dividends are not overly demanding on earnings and free cash flow.
✅ Cashflow & Capital Efficiency
Effective management of cash flows and capital allocation is evident in Tapestry’s strategies, ensuring that dividends remain sustainable alongside long-term operational efficiency.
| 2024 | 2023 | 2022 | |
|---|---|---|---|
| Free Cash Flow Yield | 11.69% | 7.82% | 9.32% |
| Earnings Yield | 8.32% | 9.25% | 10.51% |
| CAPEX to Operating Cash Flow | 13.02% | 18.89% | 11.01% |
| Stock-based Compensation to Revenue | 1.24% | 1.18% | 1.08% |
| Free Cash Flow / Operating Cash Flow Ratio | 91.33% | 81.11% | 88.99% |
The robust cash flow management and careful capital allocation enhance Tapestry’s capacity to fulfill dividend commitments while fostering growth.
⚠️ Balance Sheet & Leverage Analysis
Analyzing leverage and liquidity metrics provides insights into Tapestry’s financial stability, critical in assessing the potential risks associated with dividend payments.
| 2024 | 2023 | 2022 | |
|---|---|---|---|
| Debt-to-Equity | 3.03 | 1.45 | 1.43 |
| Debt-to-Assets | 0.65 | 0.46 | 0.45 |
| Debt-to-Capital | 0.75 | 0.59 | 0.59 |
| Net Debt to EBITDA | 2.23 | 1.84 | 1.90 |
| Current Ratio | 1.76 | 1.84 | 1.75 |
| Quick Ratio | 4.66 | 1.12 | 1.08 |
| Financial Leverage | 4.62 | 3.12 | 3.18 |
Tapestry’s debt profile remains robust enough to handle external economic pressures, ensuring the continuity of its dividend payout protocols.
💼 Fundamental Strength & Profitability
Assessing fundamental metrics and profitability ratios is essential for understanding the long-term dividend sustainability of Tapestry, Inc.
| 2024 | 2023 | 2022 | |
|---|---|---|---|
| Return on Equity | 28.17% | 41.09% | 37.47% |
| Return on Assets | 6.09% | 13.15% | 11.79% |
| Margins: Net | 12.23% | 14.05% | 12.81% |
| Margins: EBIT | 17.04% | 17.58% | 16.54% |
| Margins: EBITDA | 20.47% | 20.94% | 19.46% |
| Margins: Gross | 73.29% | 70.78% | 69.57% |
| Research & Development to Revenue | 0% | 0% | 0% |
While profitability is strong, consistent ROE and ROA figures bolster Tapestry’s ability to sustain dividend programs effectively.
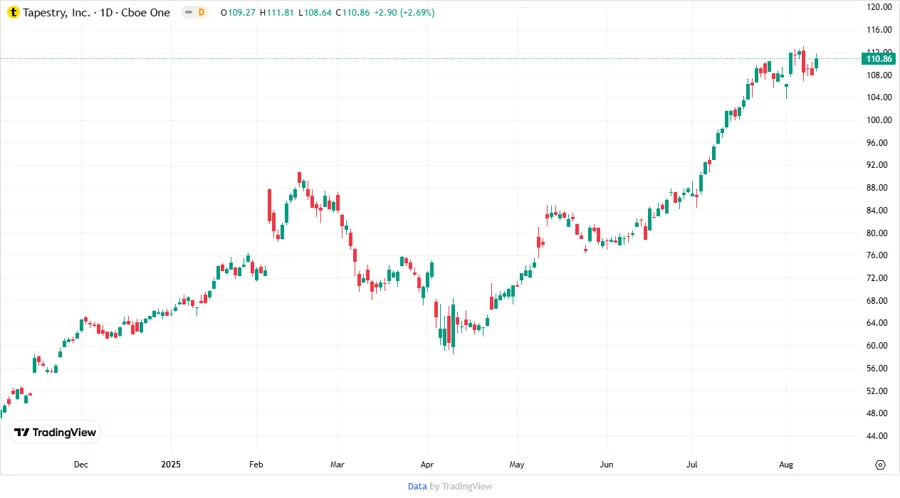
📈 Price Development
💡 Dividend Scoring System
Tapestry's dividend health can be quantitatively assessed by a custom scoring system considering various essential factors for dividend stability and growth prospects.
| Category | Score (1-5) | Indicator |
|---|---|---|
| Dividend yield | 3 | |
| Dividend Stability | 4 | |
| Dividend growth | 2 | |
| Payout ratio | 4 | |
| Financial stability | 3 | |
| Dividend continuity | 5 | |
| Cashflow Coverage | 4 | |
| Balance Sheet Quality | 4 |
Total Score: 29/40
🗳️ Rating
Tapestry, Inc. demonstrates a promising dividend strategy with consistent payouts and moderate growth, supported by sound financial metrics. However, the slow dividend growth rate and elevated debt levels require consideration. For risk-averse investors pursuing reliable income, Tapestry presents a solid albeit not aggressive dividend play. It is recommended for those valuing long-term stability over rapid income growth.
Smart Data Insight
Master the Perfect Entry & Exit for this Stock
Don't leave your profits to chance. Historically, this stock follows specific seasonal patterns that institutional traders use to maximize returns.
- ✅ Identify the "Golden Buying Window"
- ✅ Avoid high-risk correction cycles
- ✅ Backtested data from the last 20+ years