May 03, 2026 a 01:15 pm
TPL: Trend and Support & Resistance Analysis - Texas Pacific Land Corporation
Texas Pacific Land Corporation, a significant player in land and resource management, exhibits a stable yet dynamic trend pattern in recent months. The focus on water services in the Permian Basin plays a critical role in its operations, especially with the market keenly observing its expansive land royalty interests. As the company continues to navigate through fluctuating market conditions, investors are keeping a close eye on its trend dynamics, which have shown signs of volatility, indicative of broader market influences.
Trend Analysis
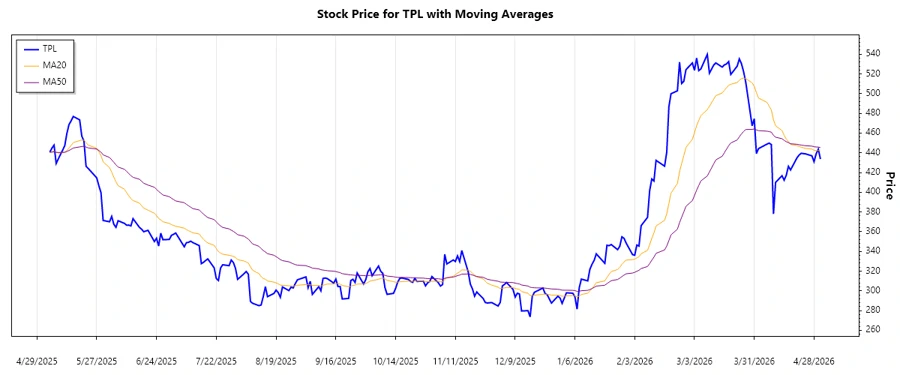
Using the provided closing prices, the EMA20 and EMA50 were calculated to determine the trend. Generally, an upward trend prevails when the EMA20 is greater than the EMA50. Similarly, a downward trend is noted when the EMA50 exceeds the EMA20. In our analysis:
| Date | Closing Price | Trend |
|---|---|---|
| 2026-05-01 | 433.62 | ▼ |
| 2026-04-30 | 443.67 | ▼ |
| 2026-04-29 | 439.03 | ▼ |
| 2026-04-28 | 430.9 | ▼ |
| 2026-04-27 | 436.9 | ▲ |
| 2026-04-24 | 438.91 | ▲ |
| 2026-04-23 | 439.15 | ▲ |
The recent closing prices suggest a shifting trend from bearish to slightly bullish, driven by short-term price upticks. The technical interpretation hints at potential market volatility with a lack of directional certainty.
Support and Resistance
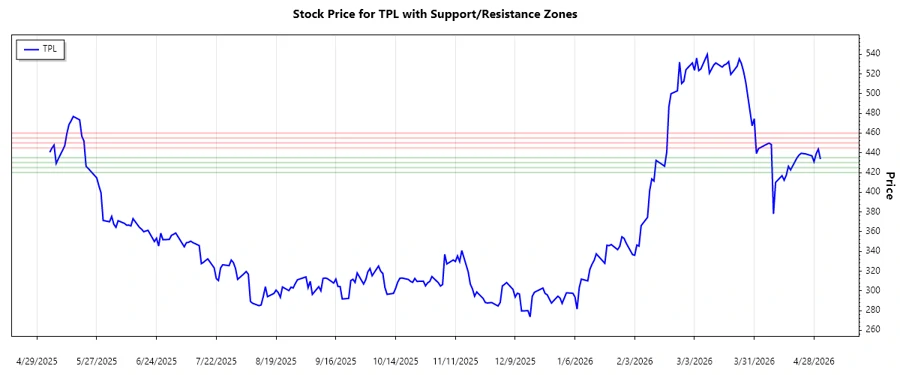
Key support and resistance zones have been identified using the recent closing price data:
| Zone Type | From | To | Direction |
|---|---|---|---|
| Support | 430.00 | 435.00 | ▼ |
| Support | 420.00 | 425.00 | ▼ |
| Resistance | 445.00 | 450.00 | ▲ |
| Resistance | 455.00 | 460.00 | ▲ |
Currently, the price is hovering around the identified support zone, indicating market indecision around these levels. This could potentially result in a reversal or continuation based on subsequent price action.
Conclusion
The current market analysis of Texas Pacific Land Corporation suggests a dynamic interplay between support and resistance levels. While the short-term trend exhibits slight bullish tendencies, the overall trend is one of cautious optimism. Analysts should monitor the identified key zones closely as they may present both opportunities and risks depending on the evolving market conditions. Overall, while capitalizing on short-term opportunities, long-term trends should be weighed against sector and economic trends.
Smart Data Insight
Master the Perfect Entry & Exit for this Stock
Don't leave your profits to chance. Historically, this stock follows specific seasonal patterns that institutional traders use to maximize returns.
- ✅ Identify the "Golden Buying Window"
- ✅ Avoid high-risk correction cycles
- ✅ Backtested data from the last 20+ years