June 18, 2025 a 01:15 pm


TPL: Trend and Support & Resistance Analysis - Texas Pacific Land Corporation
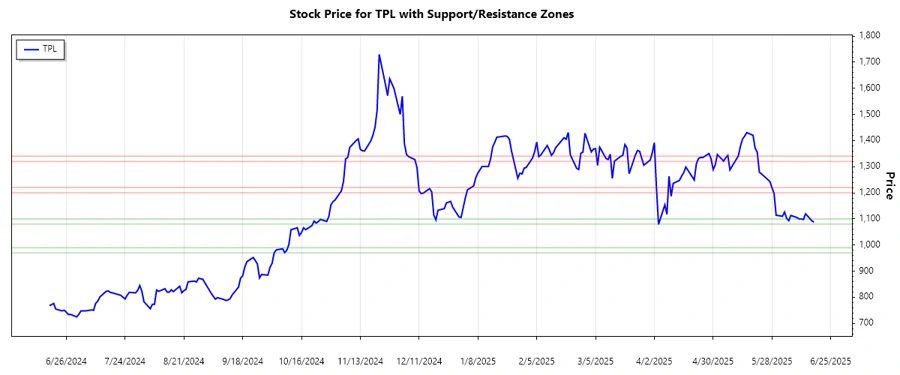
Texas Pacific Land Corporation (TPL) has shown significant volatility in recent months, reflecting its engagement in land and resource management in the competitive energy sector. This analysis evaluates TPL's current stock trend and identifies crucial support and resistance levels. Investors should be aware of potential risks due to fluctuating oil and gas prices, but the company’s substantial land holdings could offer growth opportunities.
Trend Analysis
| Date | Close Price | Trend |
|---|---|---|
| 2025-06-17 | 1087.60 | ▼ |
| 2025-06-16 | 1093.00 | ▼ |
| 2025-06-13 | 1119.58 | ▼ |
| 2025-06-12 | 1097.50 | ▼ |
| 2025-06-11 | 1100.01 | ▼ |
| 2025-06-10 | 1099.58 | ▼ |
| 2025-06-09 | 1105.04 | ▼ |
The trend indicates a bearish market with the EMA20 consistently below the EMA50, suggesting ongoing downward pressure. This signals that despite brief upticks, the market sentiment remains negative for TPL.
Support and Resistance
| Zone Type | From | To |
|---|---|---|
| Support 1 | 1080 | 1100 |
| Support 2 | 970 | 990 |
| Resistance 1 | 1200 | 1220 |
| Resistance 2 | 1320 | 1340 |
The current price resides within the first support zone, indicating potential for reversal or continuous descending movement if broken. Monitoring these levels is vital for anticipating future price actions.
Conclusion
Texas Pacific Land Corporation's stock currently faces downward momentum, constrained by the resistance zones highlighted. As the price hovers in the support territory, it recommends cautious optimism for a potential rebound, yet acknowledges the risk of further declines if the support breaks. Analysts should prepare for variability and align strategies with prevailing trends to capitalize on any emergent opportunities or mitigate risks.
Smart Data Insight
Master the Perfect Entry & Exit for this Stock
Don't leave your profits to chance. Historically, this stock follows specific seasonal patterns that institutional traders use to maximize returns.
- ✅ Identify the "Golden Buying Window"
- ✅ Avoid high-risk correction cycles
- ✅ Backtested data from the last 20+ years