November 10, 2025 a 10:15 am
TPL: Fibonacci Analysis - Texas Pacific Land Corporation
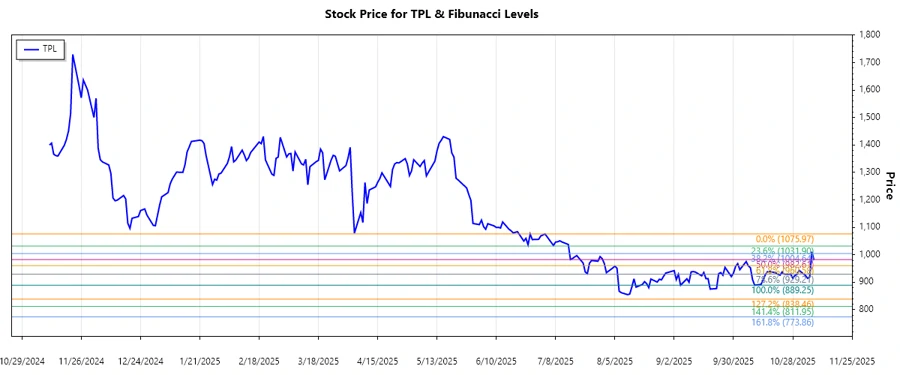
Texas Pacific Land Corporation, a significant player in land and resource management with considerable holdings in oil and gas royalty interests, has shown a mixed performance in recent months. There's a notable volatility in its stock prices, reflecting macroeconomic influences and sector-specific challenges. An analysis focusing on Fibonacci retracement levels could provide insights into potential support and resistance for future price movements.
Fibonacci Analysis
| Start Date | End Date | High | Low | Fibonacci Level | Price Level |
|---|---|---|---|---|---|
| 2025-11-07 | 2025-07-03 | 1075.97 (2025-07-03) | 889.25 (2025-10-10) | 0.236 | 919.17 |
| 0.382 | 944.10 | ||||
| 0.5 | 972.61 | ||||
| 0.618 | 1001.12 | ||||
| 0.786 | 1040.56 | ||||
As per the current analysis, the stock is close to the 0.236 Fibonacci retracement level. If the stock price retraces back to this level, it may act as a potential support.
This technical insight suggests that the stock might consolidate at these levels, offering a potential entry point for long-term investors or points of resistance for short sellers.
Conclusion
The Texas Pacific Land Corporation stock has experienced a dominant downtrend over the past months. This downtrend, spanning from early July to November, indicates some bearish sentiment or fundamental challenges. However, reaching significant Fibonacci retracement levels could signal potential stabilization or reversal opportunities. Investors should be vigilant of market conditions impacting the land and resource management sector, especially those involving regulatory changes impacting operations in the Permian Basin. Thus, while the Fibonacci retracement could signify temporary support, potential investors must weigh the external risks and intrinsic value drivers substantially.
Smart Data Insight
Master the Perfect Entry & Exit for this Stock
Don't leave your profits to chance. Historically, this stock follows specific seasonal patterns that institutional traders use to maximize returns.
- ✅ Identify the "Golden Buying Window"
- ✅ Avoid high-risk correction cycles
- ✅ Backtested data from the last 20+ years