October 22, 2025 a 11:45 am
TPL: Fibonacci Analysis - Texas Pacific Land Corporation
The Texas Pacific Land Corporation (TPL) is a prominent player in the land and resource management sector, coupled with its operations in water services. With approximately 880,000 acres under management, and significant activities in oil and gas royalty interests, TPL has been in the spotlight for investors interested in natural resources and water operations. The technical landscape has shown some fluctuations, making TPL a captivating subject for Fibonacci retracement analysis.
Fibonacci Analysis
| Attribute | Data |
|---|---|
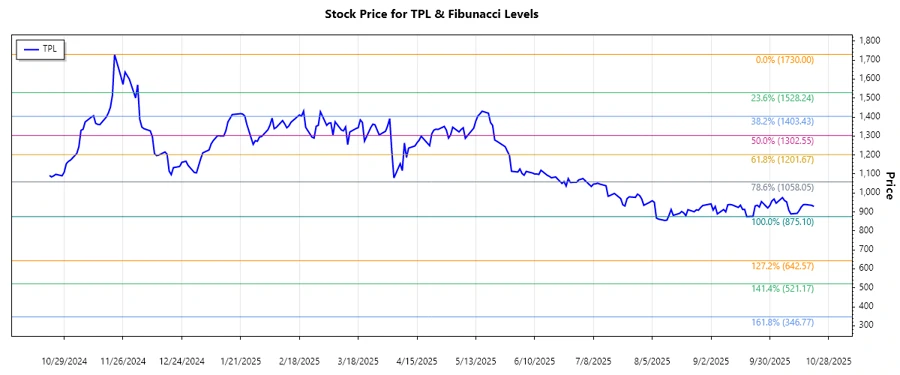
| Analyzed Trend | Downtrend |
| Start Date | 2024-11-22 |
| End Date | 2025-10-21 |
| High Point (Price and Date) | $1730.00 (2024-11-22) |
| Low Point (Price and Date) | $875.10 (2025-09-19) |
| Fibonacci Level | Price Level |
|---|---|
| 0.236 | $1045.816 |
| 0.382 | $1174.596 |
| 0.5 | $1302.55 |
| 0.618 | $1430.504 |
| 0.786 | $1603.072 |
The current price of TPL is $928.63. It appears to be in the 0.236 Fibonacci retracement zone. This level can be seen as a potential weak support area, suggesting that while there is room for upward correction, significant resistance levels might still hinder substantial price recovery.
Conclusion
The Fibonacci analysis reveals that the TPL stock has encountered a notable downward trend lately, hitting significant lows in mid-September 2025. Analysts observe that the stock is in the early stages of retracing its losses, positioned around the lower end of the Fibonacci retracement levels. Given its property portfolio and strategic initiatives in oil, gas, and water services, TPL remains a vibrant entity in the resource management sector. However, potential investors must be cautious of market volatility and regulatory changes impacting the industry. While technical barriers remain, potential growth opportunities point toward a promising trajectory, albeit with existing market risks.
Smart Data Insight
Master the Perfect Entry & Exit for this Stock
Don't leave your profits to chance. Historically, this stock follows specific seasonal patterns that institutional traders use to maximize returns.
- ✅ Identify the "Golden Buying Window"
- ✅ Avoid high-risk correction cycles
- ✅ Backtested data from the last 20+ years