
June 08, 2026 a 07:46 am

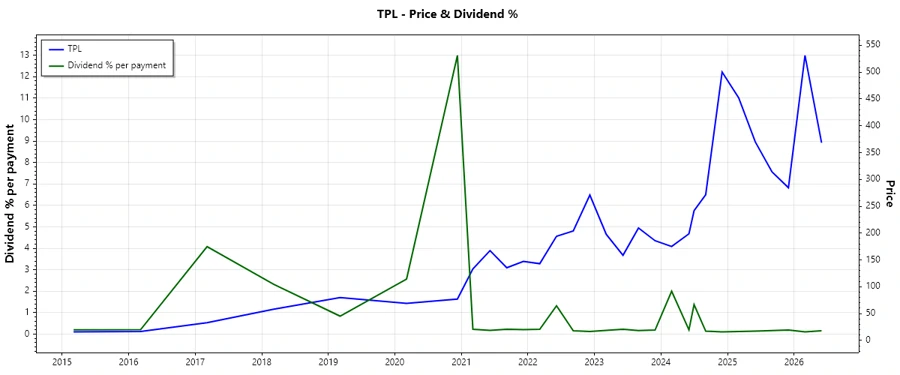


TPL: Dividend Analysis - Texas Pacific Land Corporation
The Texas Pacific Land Corporation presents a unique dividend profile, characterized by a historical commitment to returns, albeit with recent declines in growth. Despite the low dividend yield, its steadfast history of dividend payments spanning over 45 years offers investors confidence in dividend stability. With a reasonable payout ratio, TPL continues to demonstrate robust financial health, making it a potentially attractive option for income-focused investors.
Overview 📊
This section provides a snapshot of TPL's dividend landscape, highlighting key factors for investor consideration. Despite a modest dividend yield, TPL's historical dividends indicate a company with a strong commitment to returning value to shareholders.
| Attribute | Details |
|---|---|
| Sector | Energy |
| Dividend yield | 0.62% |
| Current dividend per share | 2.14 USD |
| Dividend history | 45 years |
| Last cut or suspension | None |
Dividend History 🗣️
Understanding the trajectory of dividend payouts provides insights into the company's commitment to returning value. Consistent dividend payments can establish a reliable income stream for investors, making past distributions an essential metric.
| Year | Dividend per Share (USD) |
|---|---|
| 2026 | 1.20 |
| 2025 | 2.13 |
| 2024 | 8.15 |
| 2023 | 1.44 |
| 2022 | 3.56 |
Dividend Growth 📈
Dividend growth reflects a company's capacity to increase returns to shareholders over time. A negative growth in TPL's case implies challenges or strategic reinvestments, requiring investor analysis to understand long-term potential.
| Time | Growth |
|---|---|
| 3 years | -15.66% |
| 5 years | -28.94% |
The average dividend growth is -28.94% over 5 years. This indicates a downtrend in the recent past, which might compel investors to assess the viability of future payouts.
Payout Ratio 📉
Payout ratios provide an indication of how comfortably a company can afford its dividend payments relative to its earnings and free cash flow. Lower ratios suggest a buffer for sustaining payouts through volatile earnings periods.
| Key figure | Ratio |
|---|---|
| EPS-based | 29.35% |
| Free cash flow-based | 29.97% |
With an EPS payout of 29.35% and an FCF payout of 29.97%, TPL employs a conservative approach, ensuring dividends are well-covered by available earnings and cash flow.
Cashflow & Capital Efficiency ✅
These metrics indicate TPL's capacity to generate cash flow relative to capital expenditures and overall efficiency in using its capital. High free cash flow and efficient capital utilization often translate into a company's strong financial health.
| Metric | 2025 | 2024 | 2023 |
|---|---|---|---|
| Free Cash Flow Yield | 2.46% | 1.81% | 3.34% |
| Earnings Yield | 2.43% | 1.78% | 3.36% |
| CAPEX to Operating Cash Flow | 10.51% | 6.05% | 3.59% |
| Stock-based Compensation to Revenue | 1.90% | 1.77% | 1.64% |
| Free Cash Flow / Operating Cash Flow Ratio | 89.10% | 93.95% | 96.41% |
| Return on Invested Capital | 30.12% | 35.60% | 34.84% |
TPL showcases strong cash flow potential and capital efficiency, stating its readiness to withstand financial turbulence and sustain operational needs.
Balance Sheet & Leverage Analysis ⚠️
Key leverage ratios tell us how the company is funding its operations and growth and how well it can manage its debt obligations while sustaining financial stability.
| Metric | 2025 | 2024 | 2023 |
|---|---|---|---|
| Debt-to-Equity | 2.22% | 0.04% | 0.11% |
| Debt-to-Assets | 1.99% | 0.04% | 0.10% |
| Debt-to-Capital | 2.17% | 0.04% | 0.11% |
| Net Debt to EBITDA | -0.17 | -0.65 | -1.45 |
| Current Ratio | 4.40 | 8.33 | 13.68 |
| Quick Ratio | 4.40 | 8.33 | 13.68 |
| Financial Leverage | 1.11 | 1.10 | 1.11 |
TPL's low leverage ratios underscore its minimal dependency on debt and a strong buffer against financial distress, indicative of a robust balance sheet.
Fundamental Strength & Profitability 🏦
TPL's profitability metrics, such as Return on Equity and Margins, provide insight into business efficiency and the ability to generate income relative to revenue, assets, and shareholders' equity.
| Metric | 2025 | 2024 | 2023 |
|---|---|---|---|
| Return on Equity | 32.99% | 40.09% | 38.88% |
| Return on Assets | 29.65% | 36.37% | 35.08% |
| Net Margin | 60.31% | 64.31% | 64.23% |
| EBIT Margin | 74.28% | 76.38% | 76.96% |
| EBITDA Margin | 82.12% | 79.95% | 79.29% |
| Gross Margin | 100% | 89.90% | 92.35% |
| R&D to Revenue | 0% | 0% | 0% |
The robust profitability margins reinforce TPL’s position as a high-return entity, effectively leveraging its operational efficiency and asset base.
Price Development 📈
Dividend Scoring System ⭐
Our scoring system evaluates dividends' attractiveness on multiple criteria, providing a holistic view of TPL's dividend viability.
| Category | Score | |
|---|---|---|
| Dividend yield | 2/5 | |
| Dividend Stability | 5/5 | |
| Dividend growth | 1/5 | |
| Payout ratio | 4/5 | |
| Financial stability | 5/5 | |
| Dividend continuity | 5/5 | |
| Cashflow Coverage | 4/5 | |
| Balance Sheet Quality | 5/5 |
Total Score: 31/40
Rating 🗣️
In conclusion, Texas Pacific Land Corporation is a viable candidate for income-sensitive portfolios due to its firm commitment to dividend stability and robust balance sheet. However, the negative growth rates are a concern and may necessitate cautious optimism for future dividend growth.
Smart Data Insight
Master the Perfect Entry & Exit for this Stock
Don't leave your profits to chance. Historically, this stock follows specific seasonal patterns that institutional traders use to maximize returns.
- ✅ Identify the "Golden Buying Window"
- ✅ Avoid high-risk correction cycles
- ✅ Backtested data from the last 20+ years