
May 26, 2026 a 11:31 am
TPL: Dividend Analysis - Texas Pacific Land Corporation
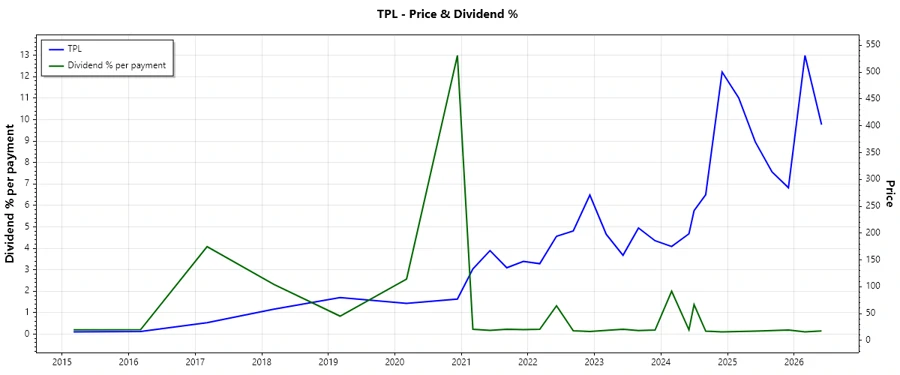
The Texas Pacific Land Corporation (TPL) makes an intriguing case for dividend-focused investors. With a dividend history spanning 45 years without recent cuts or suspensions, the company's resilience is apparent. However, its yield remains modest, underlining a particular growth and income balancing act.
📊 Overview
The following overview highlights the sector, yield, distribution, and dividend consistency of TPL:
| Category | Value |
|---|---|
| Sector | Real Estate |
| Dividend yield | 0.56 % |
| Current dividend per share | 2.14 USD |
| Dividend history | 45 years |
| Last cut or suspension | None |
🗣️ Dividend History
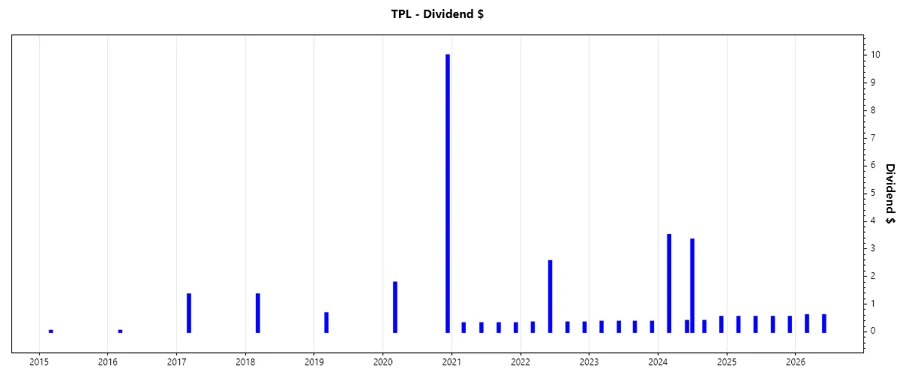
Understanding TPL's dividend history provides insight into its financial health and distribution strategy. A consistent and long-standing history indicates robust earnings stability.
| Year | Dividend per Share (USD) |
|---|---|
| 2026 | 1.20 |
| 2025 | 2.13 |
| 2024 | 8.15 |
| 2023 | 1.44 |
| 2022 | 3.56 |
📈 Dividend Growth
The growth rate of a company's dividends is a critical forecaster of its future potential. Over the last 5 years, TPL has not shown consistent dividend growth.
| Time | Growth |
|---|---|
| 3 years | -0.16 % |
| 5 years | -0.29 % |
The average dividend growth is -0.29 % over 5 years. This indicates a lack of consistent dividend growth requiring close monitoring.
⚙️ Payout Ratio
The payout ratio helps in understanding how much of the company’s earnings are being distributed to shareholders. Strong control over the payout ratio is indicative of fiscal caution and reinvestment in growth.
| Key figure | Ratio |
|---|---|
| EPS-based | 29.35 % |
| Free cash flow-based | 29.97 % |
A payout ratio of 29.35 % (EPS) and 29.97 % (FCF) is generally sustainable, allowing TPL to maintain reinvestment while rewarding shareholders.
💸 Cashflow & Capital Efficiency
Cash flow efficiency and capital allocation are pivotal for long-term growth and dividend safety. TPL demonstrates robust cash flow management:
| Measure | 2023 | 2024 | 2025 |
|---|---|---|---|
| Free Cash Flow Yield | 3.34 % | 1.81 % | 2.46 % |
| Earnings Yield | 3.36 % | 1.78 % | 2.43 % |
| CAPEX to Operating Cash Flow | 3.59 % | 6.05 % | 10.51 % |
| Stock-based Compensation to Revenue | 1.64 % | 1.77 % | 1.90 % |
| Free Cash Flow / Operating Cash Flow Ratio | 96.41 % | 93.95 % | 89.10 % |
Cash flow data aligns with sustainable dividend payouts, with effective cash resource utilization seen in these metrics.
📊 Balance Sheet & Leverage Analysis
A strong balance sheet is crucial for withstanding economic downturns while continuing dividend payments:
| Measure | 2023 | 2024 | 2025 |
|---|---|---|---|
| Debt-to-Equity | 0.11 % | 0.04 % | 0.22 % |
| Debt-to-Assets | 0.10 % | 0.04 % | 0.20 % |
| Net Debt to EBITDA | -144.57 % | -65.46 % | -17.16 % |
| Current Ratio | 13.68 | 8.33 | 4.40 |
| Quick Ratio | 13.68 | 8.33 | 4.40 |
| Financial Leverage | 110.85 % | 110.20 % | 111.27 % |
Low leverage ratios suggest stability, minimizing risk linked with capital structure and providing leeway for dividends during periods of financial stress.
✅ Fundamental Strength & Profitability
Evaluating profitability offers insights into operational efficiency and return metrics:
| Measure | 2023 | 2024 | 2025 |
|---|---|---|---|
| Return on Equity | 38.88 % | 40.09 % | 32.99 % |
| Return on Assets | 35.08 % | 36.37 % | 29.65 % |
| Net Margin | 64.23 % | 64.32 % | 60.31 % |
| EBIT Margin | 76.96 % | 76.38 % | 74.28 % |
| EBITDA Margin | 79.29 % | 79.95 % | 82.12 % |
High margins with consistent ROE and ROA indicate solid operational performance, crucial for driving earnings and maintaining payout strategies.
📉 Price Development
🎯 Dividend Scoring System
| Category | Score | Bar |
|---|---|---|
| Dividend yield | 2 | |
| Dividend Stability | 5 | |
| Dividend growth | 1 | |
| Payout ratio | 4 | |
| Financial stability | 5 | |
| Dividend continuity | 5 | |
| Cashflow Coverage | 4 | |
| Balance Sheet Quality | 5 |
Total Score: 31/40
🏁 Rating
Texas Pacific Land Corporation presents as a financially robust entity with a strong historical record and controlled payout policies. While the yield may not be overly competitive, its stability significantly surpasses the average, positioning it as a reliable income stream in times of market volatility. For those seeking sustainable dividend investment, TPL makes a solid candidate for consideration.
Smart Data Insight
Master the Perfect Entry & Exit for this Stock
Don't leave your profits to chance. Historically, this stock follows specific seasonal patterns that institutional traders use to maximize returns.
- ✅ Identify the "Golden Buying Window"
- ✅ Avoid high-risk correction cycles
- ✅ Backtested data from the last 20+ years