March 16, 2026 a 02:46 am

TPL: Dividend Analysis - Texas Pacific Land Corporation
Texas Pacific Land Corporation exhibits a relatively moderate dividend profile characterized by a low yield and a lengthy history of consistent payments. Despite slight negative trends in dividend growth, the company's financial metrics suggest robust profitability and efficiency, making it an intriguing prospect for dividend investors focused on long-term sustainability.
📊 Overview
The overview of Texas Pacific Land Corporation's dividend status provides a snapshot of its sectoral alignment and key dividend metrics.
| Detail | Value |
|---|---|
| Sector | Energy |
| Dividend yield | 0.41% |
| Current dividend per share | 2.14 USD |
| Dividend history | 45 years |
| Last cut or suspension | None |
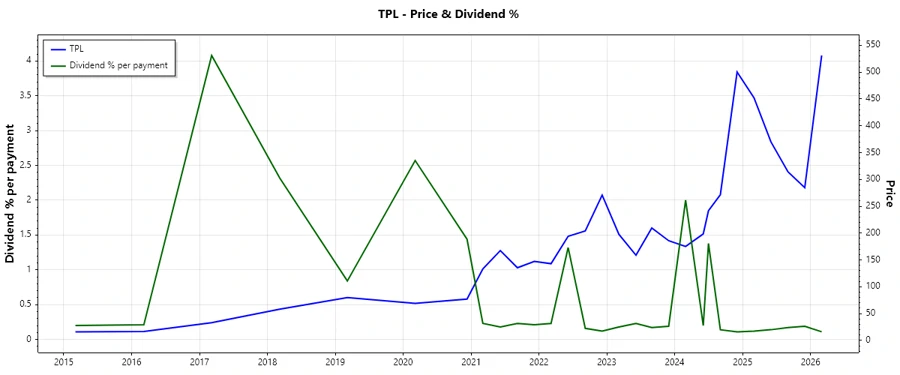
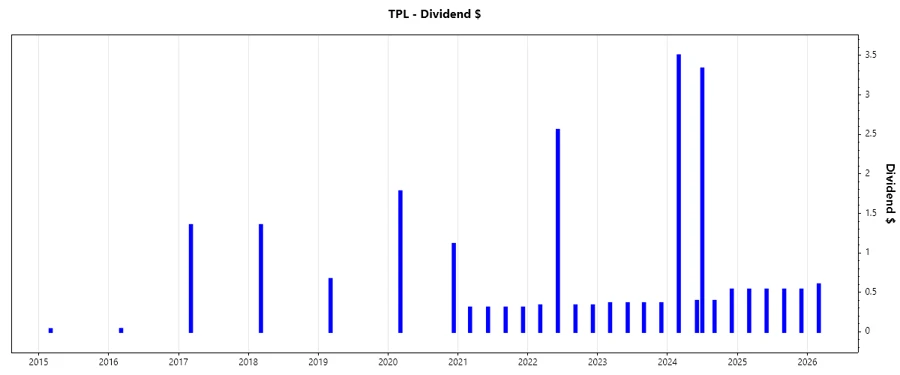
📈 Dividend History
The company's long-standing history of dividend payments over 45 years highlights its commitment to shareholder returns, although recent negative growth trends underscore the need for strategic evaluation.
| Year | Dividend per Share (USD) |
|---|---|
| 2026 | 0.6 |
| 2025 | 2.13 |
| 2024 | 8.15 |
| 2023 | 1.44 |
| 2022 | 3.56 |
📈 Dividend Growth
The negative dividend growth over the past few years reflects industry's volatile nature. Monitoring these trends is vital for investors prioritizing income growth.
| Time | Growth |
|---|---|
| 3 years | -15.66% |
| 5 years | -5.88% |
The average dividend growth is -5.88% over 5 years. This shows moderate but steady dividend decline, potentially warranting cautious investor consideration.
🗣️ Payout Ratio
Understanding payout ratios allows investors to assess dividend sustainability. TPL's EPS and FCF ratios reflect a prudent dividend strategy.
| Metric | Ratio |
|---|---|
| EPS-based | 30.70% |
| Free cash flow-based | 30.38% |
A low EPS payout ratio of 30.70% and similarly low FCF payout ratio suggest ample margin for safety, implying potential for dividend continuity.
💰 Cashflow & Capital Efficiency
Assessing cash flow strength and capital efficiency provides a comprehensive perspective on financial health and investment productivity.
| Metric | 2025 | 2024 | 2023 |
|---|---|---|---|
| Free Cash Flow Yield | 2.46% | 1.81% | 3.34% |
| Earnings Yield | 2.43% | 1.78% | 3.36% |
| CAPEX/ Operating Cash Flow | 10.90% | 6.05% | 3.59% |
| Stock-based Compensation/ Revenue | 1.89% | 1.77% | 1.64% |
| Free Cash Flow / Operating Cash Flow Ratio | 89.10% | 93.95% | 96.41% |
The combination of positive cash flow yields and efficient capital allocations demonstrates TPL's capability for sustainable operations and growth investments.
📊 Balance Sheet & Leverage Analysis
The leverage analysis helps ascertain risk associated with debt levels, essential in evaluating financial stability under stress.
| Metric | 2025 | 2024 | 2023 |
|---|---|---|---|
| Debt-to-Equity | 2.22% | 0.04% | 0.11% |
| Debt-to-Assets | 1.99% | 0.04% | 0.10% |
| Debt-to-Capital | 2.17% | 0.04% | 0.11% |
| Net Debt to EBITDA | -0.17 | -0.65 | -1.45 |
| Current Ratio | 4.40 | 8.33 | 13.68 |
| Quick Ratio | 4.40 | 8.33 | 13.68 |
| Financial Leverage | 1.11 | 1.10 | 1.11 |
Low leverage ratios indicate Texas Pacific Land Corporation's solid balance sheet, providing leeway to arise above unexpected market downturns.
🚀 Fundamental Strength & Profitability
Reviewing fundamental strength and profitability metrics is critical for determining overall financial health and earnings capabilities.
| Metric | 2025 | 2024 | 2023 |
|---|---|---|---|
| Return on Equity | 32.99% | 40.08% | 38.88% |
| Return on Assets | 29.65% | 36.37% | 35.08% |
| Margins: Net | 60.31% | 64.32% | 64.23% |
| Margins: EBIT | 74.28% | 76.38% | 76.96% |
| Margins: EBITDA | 82.12% | 79.95% | 79.29% |
| Margins: Gross | 100% | 89.90% | 92.35% |
Texas Pacific's impressive returns on equity and assets, alongside high profitability margins, showcase the firm's competitive advantage and robust financial performance.
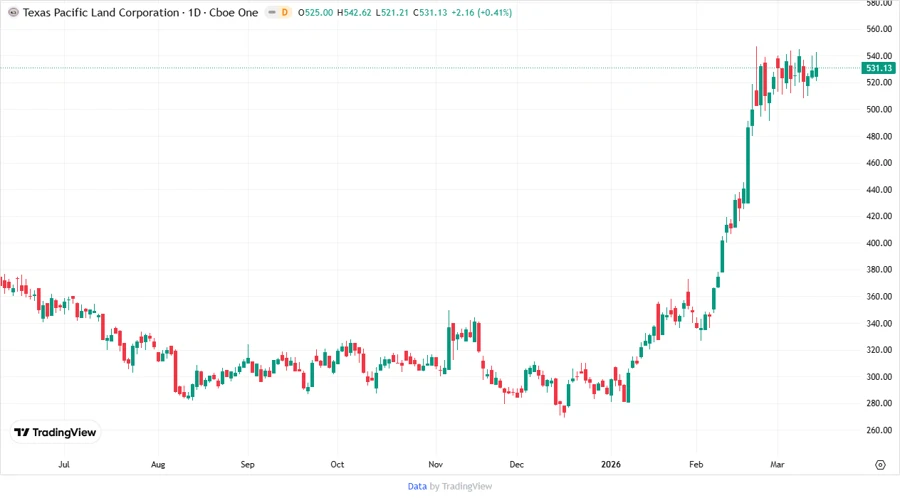
🔄 Price Development
✅ Dividend Scoring System
| Category | Score | |
|---|---|---|
| Dividend yield | 2 | |
| Dividend Stability | 4 | |
| Dividend growth | 2 | |
| Payout ratio | 5 | |
| Financial stability | 5 | |
| Dividend continuity | 4 | |
| Cashflow Coverage | 4 | |
| Balance Sheet Quality | 5 |
Overall Score: 31/40
🔥 Rating
In conclusion, Texas Pacific Land Corporation demonstrates solid financial robustness with prudent payout strategies and stable balance sheet, promising moderate dividend continuity. Despite low current yields and negative growth, long-term sustainability remains strong, offering a viable option for conservative dividend investors.