January 18, 2026 a 12:46 pm
TPL: Dividend Analysis - Texas Pacific Land Corporation
The Texas Pacific Land Corporation presents a unique approach to dividends with a history spanning over 44 years. Despite recent hurdles, including a cut in 2025, its robust financial health and commitment to shareholder returns remain commendable.
Overview 📊
Texas Pacific Land Corporation has consistently rewarded its shareholders, reflecting a commendable history over four decades. Although recent cuts were seen, especially in 2025, the overall strategy underlines a steadfast commitment to returning value through dividends.
| Detail | Value |
|---|---|
| Sector | Real Estate |
| Dividend Yield | 0.75% |
| Current Dividend per Share | 5.04 USD |
| Dividend History | 44 years |
| Last Cut or Suspension | 2025 |
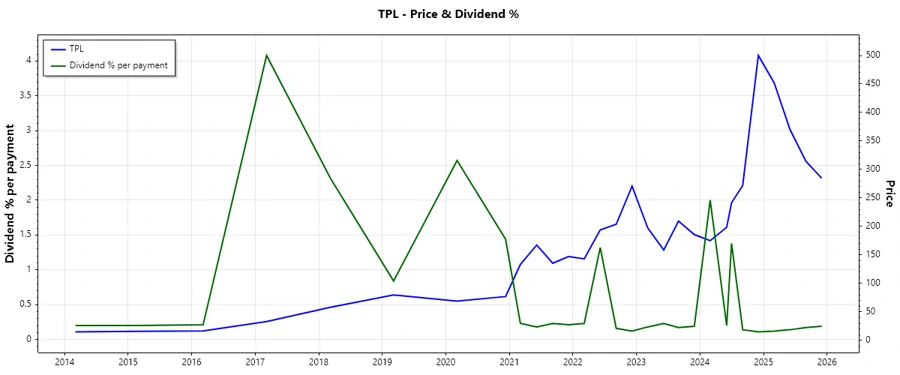
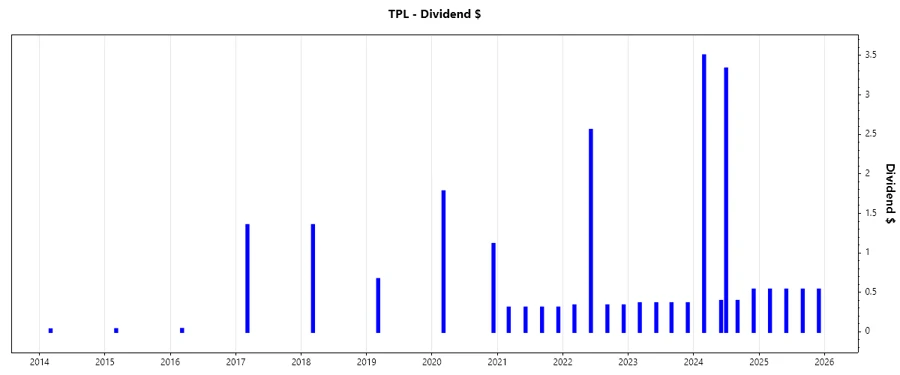
Dividend History 📈
The dividend history of Texas Pacific Land Corporation underscores its commitment over the years. Acknowledging fluctuations, focusing on the pattern offers insights into the company's future dividend policies.
| Year | Dividend per Share (USD) |
|---|---|
| 2025 | 2.13 |
| 2024 | 8.15 |
| 2023 | 1.44 |
| 2022 | 3.56 |
| 2021 | 1.22 |
Dividend Growth 🗣️
Assessing dividend growth is crucial as it reflects a company's potential for long-term shareholder value creation. For Texas Pacific Land Corporation, the negative growth over recent years highlights the pressures faced, yet it sets the stage for strategic recalibration.
| Time | Growth |
|---|---|
| 3 years | -0.16% |
| 5 years | -0.06% |
The average dividend growth is -0.06% over 5 years. This shows moderate but steady negative dividend growth, indicating potential strategic shifts in the company's payout priorities.
Payout Ratio 📉
The payout ratio is a significant metric that determines the sustainability of dividends. It reflects what portion of earnings or cash flows is paid as dividends.
| Key figure | Ratio |
|---|---|
| EPS-based | 72.9% |
| Free Cash Flow-based | 67.46% |
An EPS-based payout ratio of 72.9% and an FCF-based ratio of 67.46% suggest a relatively high portion of earnings is distributed as dividends, indicating potential challenges if expected returns from investments do not materialize.
Cashflow & Capital Efficiency ✅
The assessment of cash flow health and capital efficiency reveals insights into how well Texas Pacific Land Corporation manages its resources to sustain operations and growth.
| Key Metric | 2024 | 2023 | 2022 |
|---|---|---|---|
| Free Cash Flow Yield | 1.81% | 3.34% | 2.36% |
| Earnings Yield | 1.79% | 3.36% | 2.47% |
| CAPEX to Operating Cash Flow | 6.05% | 3.59% | 4.30% |
| Stock-based Compensation to Revenue | 1.77% | 1.64% | 1.26% |
| Free Cash Flow / Operating Cash Flow Ratio | 93.95% | 96.41% | 95.70% |
The company's efficiency in converting operating cash flow into free cash flow and managing capital investments is indicative of strong financial management. However, attention must be paid to potential pressures in increasing capital efficiency.
Balance Sheet & Leverage Analysis ⚠️
The health of the balance sheet and leverage positions are vital in assessing a company's long-term stability and risk level.
| Metric | 2024 | 2023 | 2022 |
|---|---|---|---|
| Debt-to-Equity | 0.04% | 0.11% | 0.25% |
| Debt-to-Assets | 0.04% | 0.10% | 0.22% |
| Debt-to-Capital | 0.04% | 0.11% | 0.25% |
| Net Debt to EBITDA | -0.65 | -1.45 | -0.88 |
| Current Ratio | 8.33 | 13.68 | 11.15 |
| Quick Ratio | 8.33 | 13.68 | 9.22 |
With minimal leverage, the financial risk for Texas Pacific Land Corporation appears low. Its high current and quick ratios further demonstrate a robust liquidity position.
Fundamental Strength & Profitability 📈
The analysis of fundamentals and profitability provides an understanding of how well a company employs its resources to generate returns.
| Metric | 2024 | 2023 | 2022 |
|---|---|---|---|
| Return on Equity | 40.08% | 38.88% | 57.75% |
| Return on Assets | 36.37% | 35.08% | 50.87% |
| Net Margin | 64.32% | 64.23% | 66.88% |
| EBIT Margin | 76.38% | 76.96% | 84.31% |
| Research & Development to Revenue | 0% | 0% | 0% |
While Texas Pacific Land Corporation's return ratios emphasize strong operational efficiency, the lack of R&D investments may pose challenges in maintaining a competitive edge.
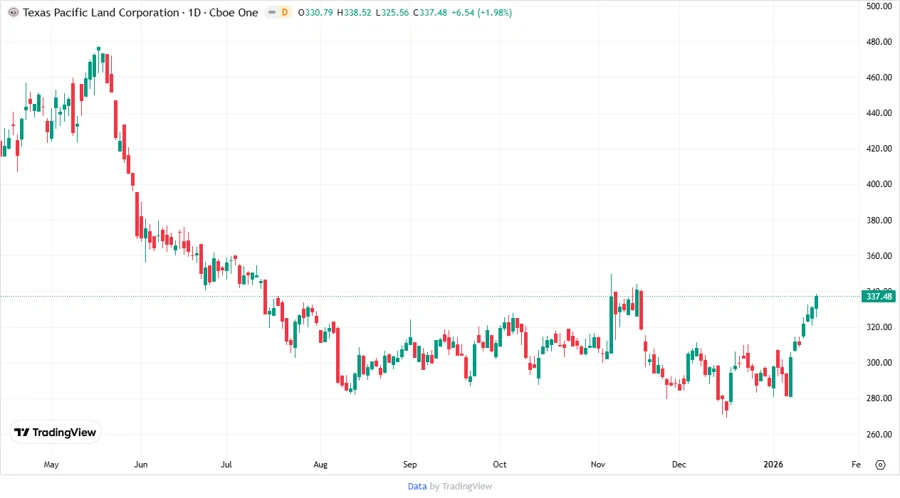
Price Development 🔍
Dividend Scoring System 🧮
| Criteria | Score | Visual Representation |
|---|---|---|
| Dividend Yield | 3 | |
| Dividend Stability | 4 | |
| Dividend Growth | 2 | |
| Payout Ratio | 3 | |
| Financial Stability | 5 | |
| Dividend Continuity | 4 | |
| Cashflow Coverage | 4 | |
| Balance Sheet Quality | 5 |
Total Score: 30 out of 40
Rating 🏆
Texas Pacific Land Corporation exhibits compelling financial indicators interwoven with challenges typical of its sectoral archetype. The firm's dividend yield might seem modest, yet it's made more potent by financial resilience and robust balance sheet metrics. It is recommended for investors prioritizing stability with a penchant for resilient cash flows in potential downturns.