October 14, 2025 a 07:31 am

TPL: Dividend Analysis - Texas Pacific Land Corporation
Texas Pacific Land Corporation, with its robust dividend profile and a consistent history of dividend payments spanning over four decades, emerges as a stable investment option. With its primary operations within the real estate sector, TPL has demonstrated resilience, particularly through its steady dividend growth and substantial payout ratios. As the company continues to leverage its considerable market cap, investors can anticipate ongoing dividend stability.
📊 Overview
| Metric | Details |
|---|---|
| Sector | Real Estate |
| Dividend yield | 0.679% |
| Current dividend per share | 15.11 USD |
| Dividend history | 44 years |
| Last cut or suspension | None |
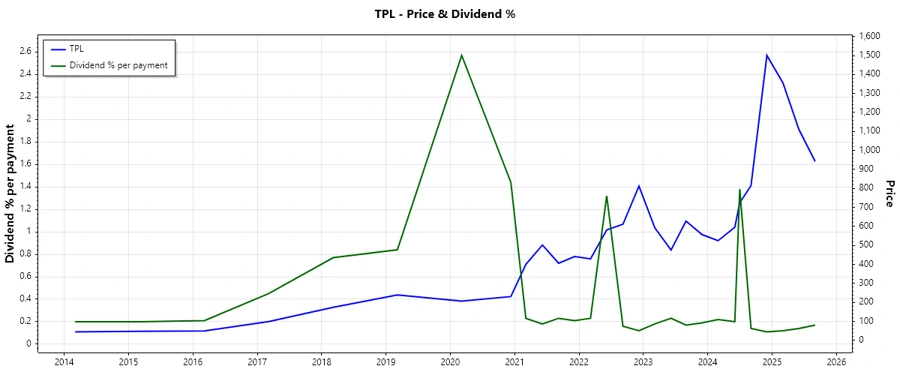
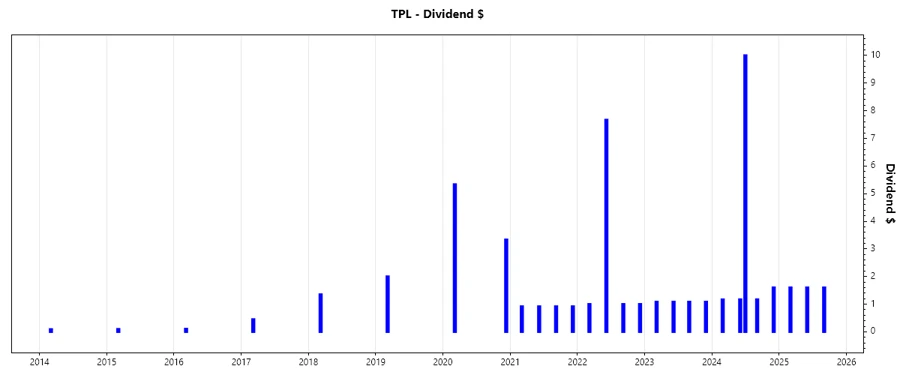
🗣️ Dividend History
The long-standing tradition of dividend payments over 44 years attests to Texas Pacific Land Corporation's commitment to rewarding its shareholders. The historical consistency indicates strong governance and financial health.
| Year | Dividend per Share (USD) |
|---|---|
| 2025 | 4.8 |
| 2024 | 15.11 |
| 2023 | 4.33 |
| 2022 | 10.67 |
| 2021 | 3.67 |
📈 Dividend Growth
Examining the dividend growth over recent years provides insights into the company’s potential for delivering shareholder value through increased dividends.
| Time | Growth |
|---|---|
| 3 years | 60.31% |
| 5 years | 49.84% |
The average dividend growth is 49.84% over 5 years. This shows moderate but steady dividend growth.
✅ Payout Ratio
Understanding the payout ratios helps gauge the sustainability of dividends concerning the company’s earnings and free cash flow.
| Key figure | Ratio |
|---|---|
| EPS-based | 75.22% |
| Free cash flow-based | 70.97% |
Payout ratios of 75.22% (EPS) and 70.97% (FCF) highlight a high dividend commitment while maintaining room for some profitability to be reinvested into the business.
⚠️ Cashflow & Capital Efficiency
Cashflow stability and capital efficiency metrics evaluate how effectively Texas Pacific Land Corporation utilizes its available resources to generate free cash flows and returns.
| Metric | 2024 | 2023 | 2022 |
|---|---|---|---|
| Free Cash Flow Yield | 1.81% | 3.34% | 2.36% |
| Earnings Yield | 1.79% | 3.36% | 2.47% |
| CAPEX to Operating Cash Flow | 6.38% | 3.59% | 4.30% |
| Stock-based Compensation to Revenue | 1.77% | 1.64% | 1.26% |
| Free Cash Flow / Operating Cash Flow Ratio | 93.95% | 96.41% | 95.70% |
These figures reveal a robust approach to handling operational cash flows and efficient allocation of capital expenditures. The ratios indicate good stability, with substantial free cash flow retained post operational expenses.
📊 Balance Sheet & Leverage Analysis
Analyzing TPL’s balance sheet empowers investors in understanding its financial leverage, debt obligation management, and liquidity position.
| Metric | 2024 | 2023 | 2022 |
|---|---|---|---|
| Debt-to-Equity | 0.04% | 0.11% | 0.25% |
| Debt-to-Assets | 0.04% | 0.10% | 0.22% |
| Debt-to-Capital | 0.04% | 0.11% | 0.25% |
| Net Debt to EBITDA | -0.65 | -1.45 | -0.88 |
| Current Ratio | 11.64 | 13.68 | 11.15 |
| Quick Ratio | 8.33 | 9.22 | 8.99 |
| Financial Leverage | 1.10 | 1.11 | 1.14 |
These low leverage ratios denote a strategic use of debt, ensuring company liquidity remains far above typical requirements, thus promising a stable financial structure.
📈 Fundamental Strength & Profitability
Fundamental strength indicators such as profitability ratios enhance understanding of how well the company generates profit relative to its resources.
| Metric | 2024 | 2023 | 2022 |
|---|---|---|---|
| Return on Equity | 40.09% | 38.88% | 57.75% |
| Return on Assets | 36.37% | 35.08% | 50.87% |
| Margins: Net | 64.31% | 64.23% | 66.88% |
| Margins: EBIT | 76.38% | 76.96% | 84.31% |
| Margins: EBITDA | 79.95% | 79.29% | 86.55% |
| Margins: Gross | 89.90% | 92.35% | 95.07% |
| Research & Development to Revenue | 0% | 0% | 0% |
High profitability ratios with consistent returns reflect superior operational efficiency, despite no investment in R&D. The profitability margins position TPL as a strong performer compared to industry standards.
📉 Price Development
✅ Dividend Scoring System
| Criterion | Score | |
|---|---|---|
| Dividend yield | 3 | |
| Dividend Stability | 5 | |
| Dividend growth | 4 | |
| Payout ratio | 4 | |
| Financial stability | 5 | |
| Dividend continuity | 5 | |
| Cashflow Coverage | 4 | |
| Balance Sheet Quality | 5 |
Overall Score: 35/40
🗣️ Rating
Texas Pacific Land Corporation stands out as a solid investment proposition with its exceptional financial stability and consistent dividend history. Despite a modest dividend yield, its outstanding dividend continuity and growth potential make it a secure, long-term investment for income-focused investors.
Smart Data Insight
Master the Perfect Entry & Exit for this Stock
Don't leave your profits to chance. Historically, this stock follows specific seasonal patterns that institutional traders use to maximize returns.
- ✅ Identify the "Golden Buying Window"
- ✅ Avoid high-risk correction cycles
- ✅ Backtested data from the last 20+ years