August 18, 2025 a 02:47 am


TPL: Dividend Analysis - Texas Pacific Land Corporation
Texas Pacific Land Corporation offers a steady yet moderate dividend yield with a history of consistent payments spanning 44 years. The company has shown positive dividend growth over recent years, further enhancing its attractiveness as a dividend investment despite its low yield. The wide market capitalization and stable financial position reinforce its ability to maintain dividend continuity.
📊 Overview
Texas Pacific Land Corporation operates within the energy sector, showing a promising yet conservative dividend yield. The longstanding history of dividend payments without any cuts indicates strong dividend reliability.
| Key Metrics | Details |
|---|---|
| Sector | Energy |
| Dividend Yield | 0.726% |
| Current Dividend per Share | $15.11 USD |
| Dividend History | 44 years |
| Last Cut or Suspension | None |
🗣️ Dividend History
Examining the dividend history showcases Texas Pacific's commitment to consistent shareholder returns. Such stability is vital for income-focused investors.
| Year | Dividend per Share (USD) |
|---|---|
| 2025 | $4.80 |
| 2024 | $15.11 |
| 2023 | $4.33 |
| 2022 | $10.67 |
| 2021 | $3.67 |
📈 Dividend Growth
The company's dividend growth metrics, particularly over 3 and 5-year periods, demonstrate a steady upward trend. Such growth is crucial for combating inflation and increasing investor value.
| Time | Growth |
|---|---|
| 3 years | 0.60% |
| 5 years | 0.50% |
The average dividend growth is 0.50% over 5 years. This shows moderate but steady dividend growth.
⚠️ Payout Ratio
Payout ratios provide insight into the sustainability of dividend payments. A high ratio may signal limited opportunity for further increases without earnings growth.
| Key figure ratio | Details |
|---|---|
| EPS-based | 75.22% |
| Free Cash Flow-based | 370.14% |
The EPS-based payout ratio of 75.22% and the exceedingly high FCF payout ratio of 370.14% suggest potential strains if earnings do not keep pace with the dividend expenditure.
💼 Cashflow & Capital Efficiency
Detailed analysis of cash flow metrics allows for a deeper understanding of liquidity and the company’s ability to fund dividends.
| Metric | 2024 | 2023 | 2022 |
|---|---|---|---|
| Free Cash Flow Yield | 0.26% | 3.13% | 2.35% |
| Earnings Yield | 1.79% | 3.36% | 2.47% |
| CAPEX to Operating Cash Flow | 86.67% | 9.56% | 4.67% |
| Stock-based Compensation to Revenue | 1.77% | 1.64% | 1.26% |
| Free Cash Flow / Operating Cash Flow Ratio | 13.33% | 90.44% | 95.32% |
The metrics suggest robust cash flow proportionate to operating cash flow, though efficiency should be balanced with maintaining or reducing current high CAPEX spend relative to cash flow.
📉 Balance Sheet & Leverage Analysis
Analyzing leverage ratios is critical for assessing financial risk associated with debt and liquidity status.
| Metric | 2024 | 2023 | 2022 |
|---|---|---|---|
| Debt-to-Equity | 0.04% | 0.11% | 0.25% |
| Debt-to-Assets | 0.04% | 0.10% | 0.22% |
| Debt-to-Capital | 0.04% | 0.11% | 0.25% |
| Net Debt to EBITDA | -0.65 | -1.45 | -0.88 |
| Current Ratio | 11.14 | 13.68 | 11.15 |
| Quick Ratio | 8.33 | 13.68 | 9.22 |
| Financial Leverage | 1.10 | 1.11 | 1.14 |
Low leverage levels indicate sound financial health, minimizing risk exposure from debt while maintaining strong liquidity status as depicted in high current and quick ratios.
✅ Fundamental Strength & Profitability
Studying profitability and return metrics assess the company’s efficiency in generating profits from equity and assets.
| Metric | 2024 | 2023 | 2022 |
|---|---|---|---|
| Return on Equity | 40.09% | 38.88% | 57.75% |
| Return on Assets | 36.37% | 35.08% | 50.87% |
| Margins: Net | 64.32% | 64.23% | 66.88% |
| EBIT | 76.38% | 76.96% | 84.31% |
| EBITDA | 79.95% | 79.29% | 86.55% |
| Gross | 89.90% | 92.35% | 95.07% |
| Research & Development to Revenue | 0% | 0% | 0% |
Exceptional profitability margins and high returns on equity underscore robust operational efficiency, aligning with strong equity returns.
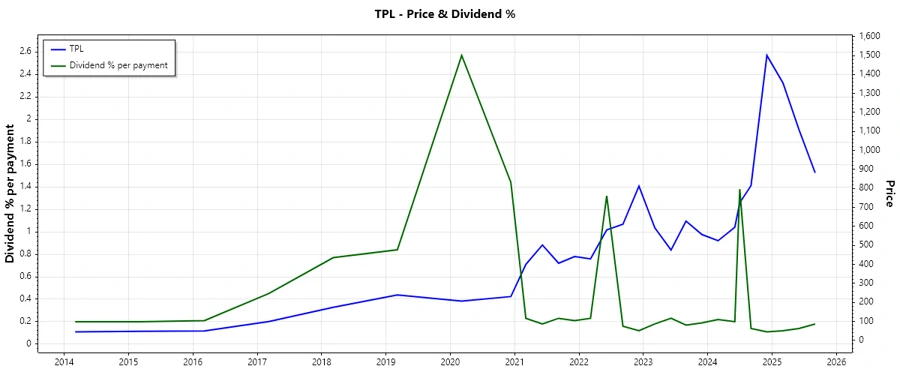
🔍 Price Development
📈 Dividend Scoring System
| Criteria | Score | Visualization |
|---|---|---|
| Dividend yield | 2 | |
| Dividend Stability | 5 | |
| Dividend growth | 3 | |
| Payout ratio | 3 | |
| Financial stability | 5 | |
| Dividend continuity | 5 | |
| Cashflow Coverage | 3 | |
| Balance Sheet Quality | 5 |
Overall Score: 31 / 40
🏅 Rating
Texas Pacific Land Corporation solidifies its position as a reliable dividend payer with impressive financial stability and consistent growth. The divestment strategy supports a moderate yield with a phenomenal payout history. Consequently, TPL stands as a recommended choice for risk-averse investors seeking stable income streams.
Smart Data Insight
Master the Perfect Entry & Exit for this Stock
Don't leave your profits to chance. Historically, this stock follows specific seasonal patterns that institutional traders use to maximize returns.
- ✅ Identify the "Golden Buying Window"
- ✅ Avoid high-risk correction cycles
- ✅ Backtested data from the last 20+ years