June 09, 2026 a 03:15 am

TMO: Trend and Support & Resistance Analysis - Thermo Fisher Scientific Inc.
Thermo Fisher Scientific Inc. has displayed notable movement in its stock prices over the previous months. Employing advanced analytical instruments and life sciences solutions, the company remains influential across multiple sectors. In recent times, the stock appears to be displaying a challenging trend with notable fluctuations, making strategic support and resistance levels crucial for investors. Understanding these key levels will aid potential investors in making informed decisions in the volatile market conditions currently faced by TMO.
Trend Analysis
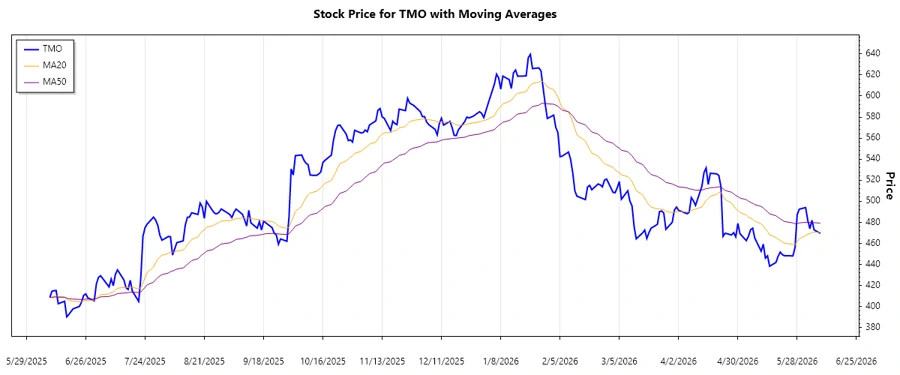
To determine the dominant trend for Thermo Fisher Scientific Inc., the EMA20 and EMA50 have been calculated. The calculated EMAs provide insights into the prevailing direction, facilitating a strategic understanding of the price momentum.
| Date | Close Price | Trend |
|---|---|---|
| 2026-06-08 | $469.63 | ▼ Abwärtstrend |
| 2026-06-05 | $472.80 | ▼ Abwärtstrend |
| 2026-06-04 | $482.03 | ▲ Aufwärtstrend |
| 2026-06-03 | $473.95 | ▼ Abwärtstrend |
| 2026-06-02 | $482.08 | ▲ Aufwärtstrend |
| 2026-06-01 | $494.04 | ▲ Aufwärtstrend |
| 2026-05-29 | $492.51 | ▲ Aufwärtstrend |
The analysis of the recent trend for TMO indicates a mixed signal, with both upward and downward trends. While the EMA20 presents a leading signal, occasionally it falls below the EMA50, indicating short-term bearish sentiments. However, the overall trend might still indicate potential upward momentum based on specific days. Investors should watch for further confirmation.
Support and Resistance
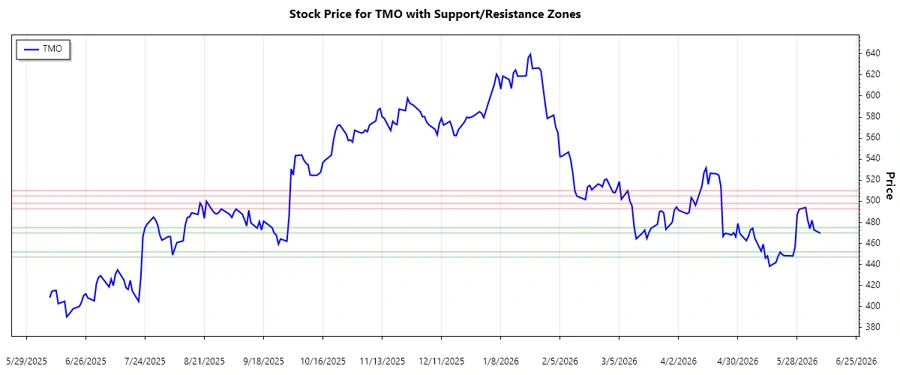
The following table highlights the computed support and resistance levels for the analyzed period. These zones represent critical price levels that the stock has frequently encountered, serving as possible reversal points.
| Zone | From | To |
|---|---|---|
| Support Zone 1 | Price: $447.00 | Price: $452.00 |
| Support Zone 2 | Price: $470.00 | Price: $475.00 |
| Resistance Zone 1 | Price: $493.00 | Price: $498.00 |
| Resistance Zone 2 | Price: $505.00 | Price: $510.00 |
The current price is fluctuating, and it is essential to consider both supports and resistance closely. As of the latest data, the stock is situated between support and resistance, making it crucial to monitor any breaches or tests of these levels.
Conclusion
The trend for TMO indicates a volatile market with alternating directional strengths. While technical indicators offer mixed signals, the stock remains between established support and resistance levels. Analysts should consider these zones as pivotal in determining future price action. The company's expansive reach across multiple sectors potentially mitigates broader market risks. However, the fluctuating trend requires vigilant monitoring and strategic adaptability for any investment decisions.
Smart Data Insight
Master the Perfect Entry & Exit for this Stock
Don't leave your profits to chance. Historically, this stock follows specific seasonal patterns that institutional traders use to maximize returns.
- ✅ Identify the "Golden Buying Window"
- ✅ Avoid high-risk correction cycles
- ✅ Backtested data from the last 20+ years