April 17, 2026 a 09:03 am


TMO: Trend and Support & Resistance Analysis - Thermo Fisher Scientific Inc.
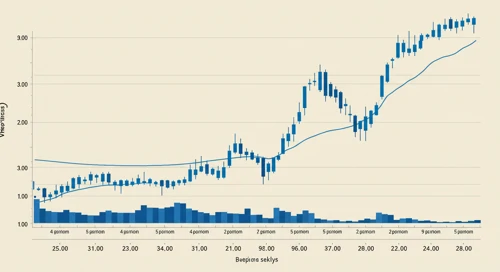
Thermo Fisher Scientific Inc. operates in life sciences, offering solutions ranging from research reagents to clinical diagnostics. Recent analysis of its stock indicates a period of fluctuation with minor support at recent lows. While the data suggests potential resilience, investors should monitor broader market tendencies and sector-specific factors. Technical indicators, as seen below, reflect short-term trends potentially influencing future price movements.
Trend Analysis
Based on the analysis of technical indicators, such as the Exponential Moving Averages (EMA), we calculate and interpret the current trend direction. Here are the findings for the past week:
| Date | Close Price | Trend |
|---|---|---|
| 2026-04-16 | 516 | ▼ Downtrend |
| 2026-04-15 | 531.67 | ► Sideways |
| 2026-04-14 | 527.22 | ▼ Downtrend |
| 2026-04-13 | 514.23 | ▼ Downtrend |
| 2026-04-10 | 496.11 | ▼ Downtrend |
| 2026-04-09 | 500.46 | ▲ Uptrend |
| 2026-04-08 | 503.46 | ▲ Uptrend |
The EMA20 has crossed below the EMA50, indicating a downtrend. This movement suggests potential selling pressure. Monitoring this pattern for possible reversals or continuations is essential.
Support and Resistance
Price movements exhibit key levels of support and resistance, which are critical for technical trading strategies. The identified zones are as follows:
| Zone | From | To |
|---|---|---|
| Support 1 | 490 | 500 |
| Support 2 | 470 | 480 |
| Resistance 1 | 530 | 540 |
| Resistance 2 | 550 | 560 |
The current price levels are approaching the lower support zone, suggesting potential entry points for buyers should the market sentiment turn positive. The analysis suggests keeping a keen eye on these levels.
Conclusion
The current technical analysis of Thermo Fisher Scientific Inc. shares indicates a developing downtrend, as evidenced by the EMA crossovers. Support is found in the mid-$400 range, with resistance around the $530 mark. Investors should monitor for any breakouts above resistance or breaches below support, which could indicate further movements. The balance of opportunity lies within market fundamentals and investor sentiment. Traders and analysts need to remain vigilant for changes in trend dynamics or sector-driven catalysts.