May 24, 2026 a 01:00 pm

TMO: Fundamental Ratio Analysis - Thermo Fisher Scientific Inc.
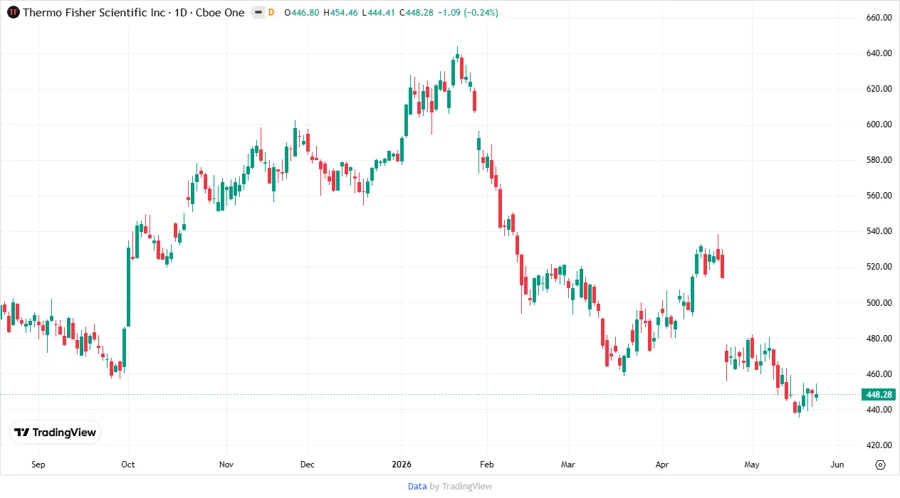
Thermo Fisher Scientific Inc. is a vital player in the healthcare sector, offering diversified services and products globally. With strong market positions in life sciences and analytical instruments, it caters to a broad spectrum of industries. As a solid performer with growth potential, the stock presents opportunities for investors seeking exposure in medical diagnostics and research.
Fundamental Rating
Thermo Fisher Scientific Inc. demonstrates a strong fundamental base with promising scores across various metrics.
| Category | Score | Visual |
|---|---|---|
| Discounted Cash Flow | 4 | |
| Return on Equity | 4 | |
| Return on Assets | 5 | |
| Debt to Equity | 1 | |
| Price to Earnings | 2 | |
| Price to Book | 2 |
Historical Rating
The historical ratings provide insight into the changes in scores, reflecting consistent performance evaluations.
| Date | Overall | DCF | ROE | ROA | Debt to Equity | P/E | P/B |
|---|---|---|---|---|---|---|---|
| 2026-05-22 | 3 | 4 | 4 | 5 | 1 | 2 | 2 |
| Previous | 0 | 4 | 4 | 5 | 1 | 2 | 2 |
Analyst Price Targets
Analyst projections indicate a robust price range, reinforcing positive sentiment around future prospects.
| High | Low | Median | Consensus |
|---|---|---|---|
| $750 | $490 | $644.5 | $638.2 |
Analyst Sentiment
Current analyst ratings are predominantly positive, indicating confidence in the stock's future performance.
| Recommendation | Count | Distribution |
|---|---|---|
| Strong Buy | 0 | |
| Buy | 38 | |
| Hold | 4 | |
| Sell | 0 | |
| Strong Sell | 0 |
Conclusion
Thermo Fisher Scientific Inc. demonstrates a solid performance trajectory with considerable strength in its financial metrics. Its diversified operations and positive market outlook make it a strong contender in the healthcare sector. However, the low debt-to-equity score highlights a more cautious approach to leveraging. Investors may find this stock appealing for its growth potential within diagnostics and research, but should remain mindful of general market volatilities.
Smart Data Insight
Master the Perfect Entry & Exit for this Stock
Don't leave your profits to chance. Historically, this stock follows specific seasonal patterns that institutional traders use to maximize returns.
- ✅ Identify the "Golden Buying Window"
- ✅ Avoid high-risk correction cycles
- ✅ Backtested data from the last 20+ years